
The U.S. Bureau of Labor Statistics released their monthly inflation data on Tuesday, October 18th and revealed an almost 38% increase in Annual Inflation in September. The annual inflation rate was 1.06% in August and increased 37.7% to 1.46% in September as a result of the Consumer Price Index (CPI-U) increasing from 240.854 to 241.428.
For the year meat poultry and fish were down -6.3%, energy was down -2.9%, while Fuel Oil was down a whopping -8.5% and used cars and trucks were down -4.1%. However, Medical care services was up 4.8%, Transportation Services was up 3.0%, Shelter was up 3.4%, and Medical Care Services was up 5.1%.
Current Annual Inflation Chart
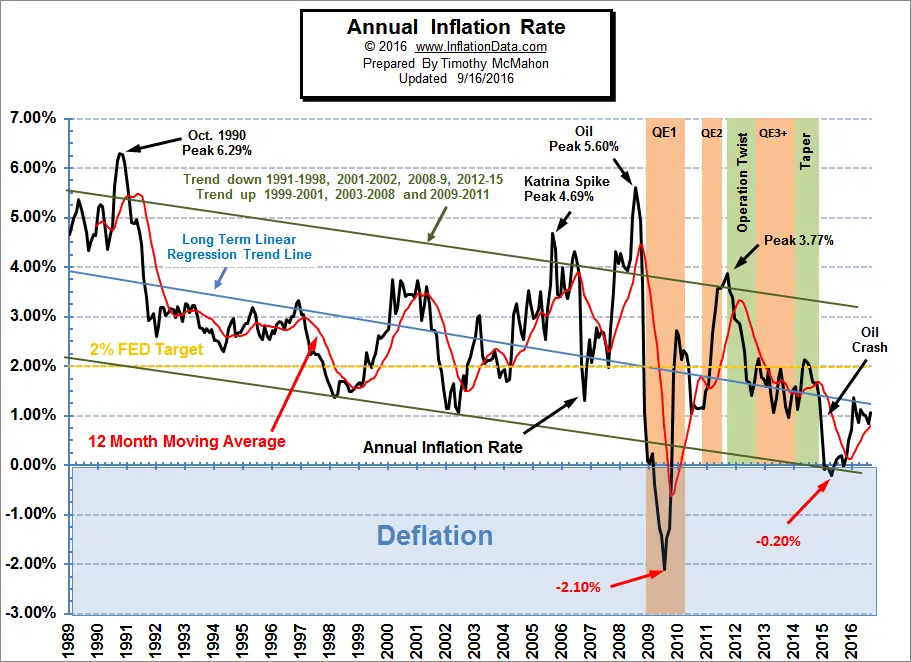 Our current annual inflation chart shows that this month’s spike in the Inflation Rate shot it well above its 12-month moving average. A move below the moving average would indicate that the trend has turned deflationary but at this point, the trend looks to be up. However, we are entering the fourth quarter when typically prices fall and disinflation gets a bit more traction. Read more Information on Current Inflation…
Misery Index
 Since both high unemployment and high inflation are major factors to the average wage earner, the misery index is a quick and dirty metric to gauge the health of the economy because as inflation rises the cost of living increases and as unemployment rises more people cross the economic line into poverty.
The original Misery index was created by economist Arthur Okun during the Johnson administration in the 1960’s, unfortunately, data for the misery index is only available back to 1948 due to the lack of unemployment numbers prior to 1948. Read more …
Stock Market Rate of Change Charts
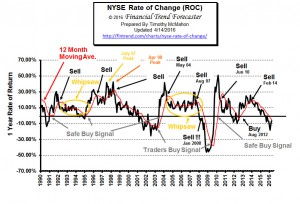 Our NYSE and NASDAQ Rate of Change (ROC) charts are helpful in getting the “big picture” of the stock market very quickly. Since these charts show the rate of return rather than the current price it is much easier to see performance, we don’t have to guess if we are up or down from last year. If we are below the zero line… we are down, if we are above the zero line… we are up. The key is to exit positions while we are in positive territory (with a gain) so we can avoid the loss and then we can reenter when we get a buy signal. Both charts are nearing new buy signals. Check them out… NYSE- ROC … NASDAQ- ROC …
Moore Inflation Predictor
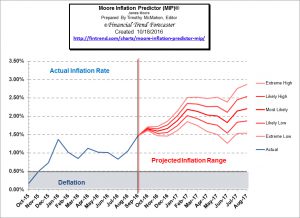 The Moore Inflation Predictor© (MIP) is a highly accurate graphical representation designed to forecast the inflation rate. By watching the turning points, we can profit from inflation hedges (like Gold, Real Estate and Energy Producers) when the inflation rate is trending up and from Bonds when the inflation rate is trending down.
Our MIP was projecting an up-move with a maximum of 1.42% , so the actual move was slightly higher than our projection. Monthly inflation was 0.24% for September 2016 replacing a -0.16% for September 2015.
This month, the MIP is projecting another up move for October followed by a bit of a decline over the following months. See what the MIP is projecting now …
The Lust for War
 This is starting to sound pretty ominous. The Washington War Party is coming unhinged and appears to be leaving no stone unturned when it comes to provoking Putin’s Russia and numerous others.
The recent collapse of cooperation in Syria — based on the false claim that Assad and his Russian allies are waging genocide in Aleppo — is only the latest example.
Other Articles You May like:
- How International Inflation and Currency Fluctuations Affect Todays Businesses
- Choosing the Right Investment: Gold vs. U.S. Dollar vs. Bitcoin
- Should You Invest in Gold?
- 2008 Financial Crisis- Then vs. Now
- Why Nervous Pensioners Are Running for the Exit
- Is Fast Food Slowing Down? Five Growing Trends in Restaurants Today
- Could A Lithium Shortage De-Rail The Electric Car Boom?
- September Unemployment Numbers
- Tips for Climbing to the Top of the Ladder
- Financial Solutions for Unemployed Dads
- How Prepping Your Air Conditioner This Fall Can Save You Money in the Future
- 6 Ways to Stuff Your Piggy Bank
- Creative Ways to Save on Monthly Expenses
- The Personal Side of Retirement
- 4 Reasons Your Family’s Investment Plan Isn’t Adding Value
- 4 Tips For Creating A Solid Family Financial Plan
- What is a CD Ladder?

careful with taking percentage of a percentage.