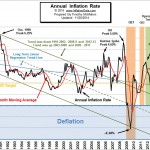
The U.S. Bureau of Labor Statistics released their monthly Consumer Price Index (CPI) data on Wednesday December 17th for November and reported lower inflation. The CPI for November was 236.151 down from 237.433 for October. This resulted in a monthly decrease in prices of -0.54% and an annual inflation rate of 1.32% down from 1.66% in October.
View the chart and read the full commentary on the current annual inflation rate.
Although the FED has been targeting a 2% annual inflation rate, rates are currently much lower and have often been considerably higher than 2% as well. The FED has hit their 2% target a total of 6 times out of more than 300 data points. If we count all the times they crossed the target or even got close we get a total of about 25 or about 8% of the the time. Virtually everyone believes that central banks and government policies control the markets. But as we can see they don’t even have precise control of the inflation rate. Read more.
Oil and Gold
With the recent collapse in the price of oil (See: Oil Price Tumbles After OPEC Releases 2015 Forecast)
it has become a “hot topic” of conversation and a primary mover in the deflationary forces moving the Consumer Price Index.
Because inflation decreases the value of of money, it is difficult to measure the cost of commodities over long periods of time because the “yard stick” is constantly changing value. Therefore it is necessary to use the inflation adjusted price when we consider the price of a commodity like Oil. Here at InflationData we have provided a variety of charts of the inflation adjusted price of commodities like Oil, Gasoline, Electricity, Natural Gas, Stock Market, Housing Prices, Education Costs and much more.
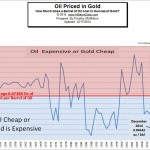
But each of these requires you to rely on potentially flawed inflation statistics generated by some outside agency or government. If that agency has an agenda other than accuracy your cost estimates could be flawed. But there is an alternative and that is to compare your selected commodity to another commodity. Often the commodity of choice is gold because of its monetary history. This month we have created a chart of oil priced in ounces of gold.
99% of oil forecasts out there are based on so-called fundamentals. The same “fundamentals” that back in June, when oil cost $107 a barrel, promised even higher prices due to:
- The rising threat of Islamic State in Iraq
- Weak U.S. dollar and
- Strong U.S. job growth
Now that oil has fallen to $54, the same sources are giving you “reasons” why it should fall even more.
Elliott Wave International has just released a new report from their in-house Energy expert giving you a unique look at the trend in Crude.
Special Report: “Oil: What’s Next?”
EWI’s Chief Energy Analyst, Steve Craig, has lived the oil market for close to 30 years. In this free report, Steve shares his take on where oil has been — and where it’s going.
Access your free oil report today and get a fresh perspective on crude oil.
You might also enjoy:


Leave a Reply