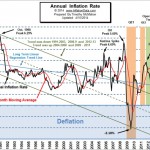
The current CPI for the month of April was 237.072 which resulted in monthly inflation being up 0.33% in the month of April causing the annual inflation rate to jump from 1.51% up to 1.95%.
Last month we told you to be aware that this month’s jump would be seen as a possible return to inflation and of course the main stream media and even some of our competitors fell right into that trap. USInflationCalculator for instance quoted the Wall Street Journal as saying,
“Inflation may be normalizing a bit faster than we thought,” the Wall Street Journal quoted Laura Rosner, U.S. economist at BNP Paribas. “It’s still too early to assume this will persist, but it certainly raises the risks of higher inflation at year end than we are currently forecasting.”
And they hyped the continued climb in food and shelter costs. But as we know the first quarter has the majority of the inflation for the year and this month’s jump was primarily because April 2013 happened to have a negative monthly inflation rate. So when it falls out of the calculation the annual inflation rate has to jump unless it is replaced by another negative number.
So in a way, I agree with Ms. Rosner, it is too early to jump on the inflation bandwagon. But I disagree with the second part of her statement that the risks of higher inflation by year-end are increasing.
Reuters took up the inflation banner by saying, “Inflation Stirring- In the 12 months through April, consumer prices rose 2.0 percent after gaining 1.5 percent in March. The increase was the biggest since July last year…”
However, as we know inflation actually rose 1.95% and was rounded up to 2%. Had it been 1.94% the BLS would have published the number as 1.9%. Would 1.9% have resulted in the same level of alarm? Who knows… a little bit of panic helps sell newspapers. But you and I won’t be drawn into their little web because we know better.
What Really Happened?
On a monthly basis we did see some spikes in prices. Meats, poultry, fish, and eggs were up 1.6%, Gasoline was up 3.6% and airfares were up 5.2% but airfares go up every year at this time due to the beginning of summer travel season.
On the other hand, fuel Oil prices were down -3.0% for the month, Electricity was down -2.7% for the month, and Natural Gas was down -1.2%. So where does that leave us?
Is Inflation Really Trending Higher?
Let’s look at how many times the inflation rate has been above 1.9% over the last few years? It was 1.96% in July of 2013 and it was 1.98% in February 2013, and at 1.99% in September 2012. But wait it was well over 2% several times in 2012, at 2.93% in January, 2.87% in February, 2.65% in March, 2.30% in April and at 2.16% in October. So we are not seeing gradually creeping inflation. The FED is targeting 2% inflation and whenever it drops too far below that the FED panics at the fear of deflation and tries to pump up the money supply. Although Robert Prechter believes The Fed Does Not Control Inflation and Deflation.
This month’s Moore Inflation Predictor is projecting that inflation will be basically flat for May and then turn slightly down before resuming its climb later in the year.
 In this month’s Annual Inflation rate chart we can see the sharp spike in the inflation and the effects of Quantitative Easing in the orange shaded regions. We noted that although QE1 and QE2 resulted in a rebound in inflation so far QE3 has had little or no effect.
The Misery Index
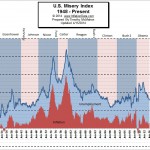
 This month’s misery index is up very slightly from 8.21% to 8.25% with the official unemployment rate flat for the month at 6.3% and the inflation rate at 1.95%.
See Also:


Leave a Reply