
• Home
  • Related Sites
    • Financial Trend Forecaster
      • Moore Inflation Predictor
      • NYSE Rate of Change (ROC)
      • NASDAQ Rate of Change (ROC)
      • Crypto ROC- BTC & ETH
    • Unemployment Data
      • Historical Employment Data
      • Unemployment Rate Chart
      • Labor Force Participation Rate
    • Optio Money
    • Elliott Wave University
    • More Resources
  • Definitions
    • What is Inflation?
    • What is Core Inflation?
    • Inflation vs CPI
    • What is Deflation?
    • What is Disinflation?
    • What is Agflation?
    • What is Stagflation?
    • What is Hyperinflation?
    • What is Quantitative Easing?
    • What is Quantitative Tightening?
    • What is Velocity of Money?
    • What is Fiat Currency?
    • How Do I Calculate Inflation?
    • What are “Sticky Prices” and Why Do They Matter?
  • Featured Content
  • About Us
  • Feedback
    • Sitemap
  • Subscribe Now

InflationData.com

Your Place in Cyber Space for Inflation Data

CPIWidget-July26
  • Numerical Inflation Data
    • Current Inflation Rate
    • Monthly Inflation Rate (Moved)
    • Historical U.S. Inflation Rates
    • Historical CPI
  • Inflation Charts
    • Ann. Inf. Rate Chart
    • Long Term Inflation >
      • Ave. Inf. by Decade
      • Total Inf. by Decade
      • Inflation 1913-1919
      • Inflation 1920-1929
      • Inflation 1930-1939
      • Inflation 1940-1949
      • Inflation 1950-1959
      • Inflation 1960-1969
      • Inflation 1970-1979
    • Cumulative Inflation
    • FED Monetary Policy and Inflation
    • Inflation and Recession
    • Confederate Inflation (1861 – 1865)
    • Misery Index
    • The 3 Stages of Inflation
    • 15-Yr Inflation Trends Chart
  • Inflation Calculators
    • Cumulative Inf. Calc.
    • How Much Would it Cost
    • Historical Inflation Calculator since 1774
    • Salary Inf. Calc.
    • U.K. Inf. Calc.
    • Cost of Gas Calc.
    • Net Worth Calc.
    • Lifetime Earnings Calc.
    • Savings Goal Calc.
    • Financial Calculators
  • Inf. Adjusted Prices
    • Energy >
      • Inflation Adj. Gas Prices
      • Historical Oil Prices Chart
      • Crude Oil Price (Table)
      • Natural Gas Prices
      • Electricity Prices
      • Oil vs Gold
    • Gold >
      • Inflation Adjusted Annual Average Gold Prices
      • Gold is a “Crisis Hedge” not an  “Inflation Hedge”
      • Comparing Oil vs. Gold
    • Corn Prices
    • Education Inflation
    • Housing Prices
    • Mortgage Rates
    • NYSE Index
    • Inf. Indexed Bonds
    • Movie Revenues
    • Inflation-Adjusted Wages
  • Cost of Living
    • Calculate Cost of Living
    • Cost-of-living Adj. (COLA)
    • Consumer Price Index CPI
      • Historical CPI
      • Current CPI
      • CPI Release Dates
    • Gas Prices >
      • Cost of Gas
      • Cost of Gas Per Month
      • Gas vs. Oil Price Chart
    • Food Prices 1913 vs 2013
    • Health Insurance
  • Blog
    • Key Inflation Articles
    • International Inflation
    • Historical Inflation Rates for Japan (1971 to 2014)
You are here: Home » Blog » Government » The Federal Reserve » Do Central Banks Move the Markets?

Do Central Banks Move the Markets?

Published on April 23, 2009 Updated on February 17, 2014 by Elliott Wave International

Central Banks are like the giant gorilla of the investment world. Everyone thinks they can do anything they want.  But can they? Or are they subject to the laws of the universe just like everyone else? They do wield a lot of clout for a day or so when a new announcement comes out but do they really have a lasting effect on the markets? In this article Mark Galasiewski of Elliott Wave International gives us a look at what the effect of the Central Banks really is.   — Editor

Think That Central Banks Move the Markets? Think Again.

By Mark Galasiewski

The following is excerpted from Elliott Wave International’s Global Market Perspective.

Conventional wisdom says that central banks can influence or even direct financial markets and the macroeconomy. The very existence of Elliott waves challenges such assumptions. For if markets responded to every central bank directive, how could Elliott waves exist? Parallel trend channels, Fibonacci price relationships, the similarity of form between waves of different sizes and time periods—none of that would be possible. Central bank decisions would have to coincide perfectly with turning points in Elliott waves, and we know that just doesn’t happen. But even without using waves, we can expose the conventional wisdom for the fallacy that it is.

Take, for example, this assertion in a recent article in a U.K. economic weekly: “Part of the aim of central banks in driving down interest rates is to encourage a greater risk appetite among investors.” Two key assumptions underlie that statement: a) central banks determine interest rates; and b) lower interest rates can increase society’s appetite for risk.

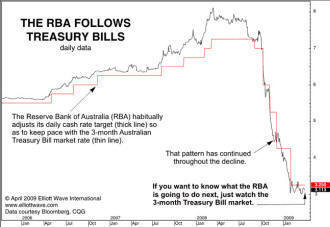
To see how the first assumption is false, let’s take a look at the daily chart of Australian interest rate data. It duplicates a study that Elliott Wave International has often done with U.S. interest rate data. It shows how movements in the cash target rate set by Australia’s central bank, the Reserve Bank of Australia (RBA), appear to follow those in 3-month Australian Treasury Bills. After decisive moves up in T-bills from 2006 to early 2008, for example, the RBA faithfully raised its target. T-bills have since led the RBA during the financial crisis of the past year. In fact, the record indicates that the RBA almost always follows T-bills over time.
RBA follows Treasury Bills

The proper conclusion to draw is not that the RBA has orchestrated the decline in rates since the early 1980s—but that it’s been riding it. During good times, central bankers look like geniuses; during bad times, they get tarred and feathered. Closer to the truth is that their interest-rate decisions are not proactive, but reactive, and that they continually follow in the footsteps of the market for lack of any other useful guide.

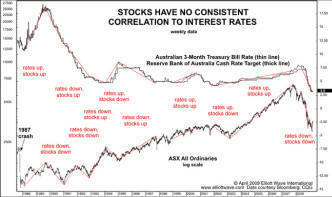
Now let’s look at the second assumption: that lower interest rates increase society’s appetite for risk. A simple glance at the weekly chart shows this assumption to be false.
Stocks have no correlation to Interest Rates

After the 1987 crash, the ASX All Ordinaries actually rallied for two years on rising rates and then sold off through 1990 on falling rates. Stocks then rose in 1991 on continued falling rates and sold off in 1992 on even lower rates. Continue following the chart to the right and you will see that there is no consistent correlation between the direction of interest rates and that of the stock market.

The myth of central bank potency is so pervasive that conventional analysts can’t even imagine a better explanation for price trends: that the market is the dog wagging its central bank tail, not the other way around.


Mark Galasiewski is the editor of Elliott Wave International’s Asian Financial Forecast and member of EWI’s Global Market Perspective team covering Asian stock indexes.

Filed Under: Economy, The Federal Reserve Tagged With: central banks

Recent Posts

  • June Inflation Down Sharply
  • How Explosive Growth in AI Triggers Inflation
  • Warsh’s First FOMC: No Dot, No Guidance, and No Dovish Pivot
  • May Inflation Up to 4.25%
  • May 2026: BLS April Inflation

Subscribe Now

eTrends Signup Form

A Message from Our Editor

Eliminate Debt

Post Archives

Sponsored:

As a Seasoned Investor I thought I'd seen everything... But recently I discovered TradingView which has really improved the information I have at my fingertips.~ Tim McMahon, editor

TradingView gives me an edge... including powerful charting tools, real-time market data, and a global community of traders—all in one easy to use platform. It has hundreds of indicators, and even custom scripts for more advanced users, and you don't need to change Brokers just use its seamless brokerage integration... TradingView isn't just a charting tool—it's your full trading command center.

Trade smarter. Trade faster. Check Out TradingView for free.

----------

The Best Place to Buy Your Crypto

Coinbase is the largest Crypto Trading platform in the U.S. and the easiest to use. ~Tim McMahon, editor

Check out Coinbase here

Home | Articles | Sitemap | Terms of Service | Privacy | Disclaimer | Advertise With Us

Copyright © 1996-2026 · Capital Professional Services, LLC · Maintained by Design Synergy Studio · Admin

Do Not Sell My Personal Information