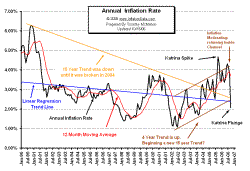
At 2.06% September’s Annual Inflation rate came in at almost exactly half of the 4.15% Annual rate that existed only two months earlier in July.
But does that mean that all of our inflation worries are over, the FED’s tightening has worked and all is right with the world? Not Hardly!
I certainly wish we were reentering the days of low inflation, low interest rates and a recovering economy. But that is not the case this month. What we have is a simple rebound effect from… believe it or not… Hurricane Katrina.
It is hard to believe but the one year anniversary of Hurricane Katrina has passed. With it’s passing we have the spike in prices that it caused passing too. The interesting thing was that November and December of 2005 had negative inflation as prices for Oil and Gas returned to normal after the huge hurricane induced spike.
That combined with an exceptionally low monthly inflation rate has given us inflation rates that we haven’t seen since 2002. It is interesting to note that the monthly inflation rate for September 2005 was 1.22% and almost as a mirror image September 2006 -0.49%. Yes that means that for the month of September 2006 we had a decrease in prices (deflation) of almost ½%.
This is not the first time prices have fallen on a monthly basis during the last year. They fell .80% in November 2005 and they also fell .40% in December 2005. Note that those two negative numbers almost exactly counteract the 1.22% increase of September 2005.
This is simple to explain as prices were simply returning to their normal prices after the supply disruptions related to the hurricane were resolved. But now we still have those two extremely low numbers left in our Annual Inflation Rate and the big increase that it counteracted has been removed (and replaced with another negative number) so current inflation rates are looking very low but once the November and December are removed we will be back to normal with an inflation rate in the 3+% range.
So hold off on the celebration until we see what November and December brings.
The Table below shows the individual monthly components of the Annual Inflation Rate.
| Month | Monthly Inflation Rate |
| January 2005 | 0.21%— Out |
| February 2005 | 0.58%— Out |
| March 2005 | 0.78%— Out |
| April 2005 | 0.67%— Out |
| May 2005 | -0.10%— Out |
| June 2005 | 0.05%— Out |
| July 2005 | 0.46%— Out |
| August 2005 | 0.51%— Out |
| September 2005 | 1.22%— Fell Out |
| October 2005 | 0.20%— Going Out next |
| November 2005 | -0.80%— In |
| December 2005 | -0.40%— In |
| January 2006 | 0.76%— In |
| February 2006 | 0.20%— In |
| March 2006 | 0.55%— In |
| April 2006 | 0.85%— In |
| May 2006 | 0.50%— In |
| June 2006 | 0.20%— In |
| July 2006 | 0.30%— In |
| August 2006 | 0.20— In |
| September 2006 | -0.49% — Newest In |


Leave a Reply