
Inflation-Adjusted Corn Prices
Updated 8/28/2022
With inflation heating up just about everywhere, corn prices are no exception. Nominal corn prices reached a new high in April 2022… and on August 24th, Bloomberg published an article entitled, U.S. Midwest Crop Tour Stokes Fears of Looming Corn Shortage. The article highlights the damage done to this year’s corn crop, including… “Parched soils. Grasshopper infestations. Scorching heat. Hail damage... scouts currently on a four-day tour through the Midwest are finding plants that are stunted and browning.” That could drive corn prices back up to or even above previous highs.
But as we always say, to get the true historical picture, we need to look at the inflation-adjusted price. On a monthly basis, prices have come down from their April peak, but as of this writing, we don’t have the monthly average price for August, so if the Bloomberg article is right, we could see the average price for August (or September) much higher. The variety of external factors that can cause corn prices to fluctuate are one reason that economists will exclude “food and energy” when trying to determine the impact that monetary policy is having on prices. For more info see: What is Core Inflation and Why doesn’t it include Food and Energy?
The addition of ethanol (corn alcohol) to gasoline in the early “teens” caused corn prices to spike but now prices are spiking again.
Ethanol’s Effects on Corn Prices
Over a 12-year period, from 2000 to 2012, corn prices exploded from a low of just over $75 per ton to a high of almost $333 by August of 2012.
In July of 2000, corn was making lows of around $75/ metric ton with highs for the year up around $95/ton. Obviously, corn is volatile if it can move 30% in a few months. This can be due to weather conditions causing crop failures or other external factors.
On the other hand, weather alone doesn’t account for the quadrupling of corn prices by August of 2012, when corn was selling for over $332.95 a ton. There was speculation that the dramatic increase in the price of corn was the result of ethanol becoming part of the gasoline mix, which drove up demand in excess of supply. It obviously took several years for farmers to ramp up production but beginning in 2013, prices began to fall again, bringing prices back down to 2006 levels.
But how does that price compare to historical corn prices?
As we always say, the only way to see the true picture is to look at the price in “inflation-adjusted” terms.
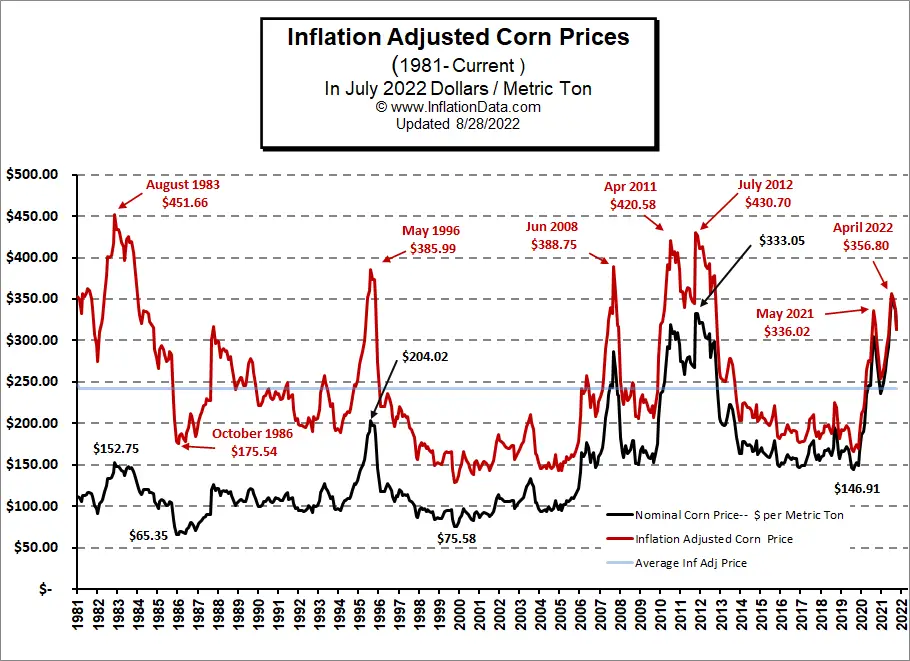
In the chart below, the black line represents the nominal (or actual price) per ton of corn since 1981. As you can see the nominal price stayed between $75 and $150 up until 2006. The only exception was a couple of months during 1996 when prices spiked up to $200. From 2006 onward, however, prices began climbing and even with the lows from 2014-2019, corn prices barely made it below $150 a ton. One of the reasons given for this new “floor” under the price of corn is the increased demand from ethanol producers who use it to produce a gasoline additive/alternative.
The light blue line is the average inflation-adjusted price. So, whenever the red line is below the blue line, prices are lower than average, and whenever the red line is above the blue line, corn prices are higher than average. As you can see we had several years i.e. from 2014-2020 when corn prices were lower than average but in 2021 corn prices have jumped up higher than average. Although, if the May 2021 price holds as the peak, then it wasn’t the worst peak since 1981.
Being an agricultural product, corn prices are not only volatile but also seasonal. They are not only affected by monetary creation issues but also by weather, supply, and demand. But by looking at the prices adjusted for inflation we can get a much better picture of how expensive corn is compared to other commodities and services.
| Monthly Corn Prices (in $/Metric Tons) 1981-Present |
||
|---|---|---|
| Date | Nominal Price | Inflation Adjusted Price |
| Oct-81 | $111.41 | $353.41 |
| Nov-81 | $110.62 | $349.78 |
| Dec-81 | $105.51 | $332.55 |
| Jan-82 | $113.38 | $356.22 |
| Feb-82 | $112.59 | $352.62 |
| Mar-82 | $114.17 | $357.95 |
| Apr-82 | $116.14 | $362.59 |
| May-82 | $116.53 | $360.39 |
| Jun-82 | $114.96 | $351.13 |
| Jul-82 | $111.41 | $338.54 |
| Aug-82 | $101.18 | $306.83 |
| Sep-82 | $97.63 | $295.46 |
| Oct-82 | $90.94 | $274.37 |
| Nov-82 | $102.75 | $310.64 |
| Dec-82 | $105.51 | $320.29 |
| Jan-83 | $108.26 | $327.96 |
| Feb-83 | $117.32 | $355.05 |
| Mar-83 | $125.19 | $378.86 |
| Apr-83 | $133.46 | $401.02 |
| May-83 | $133.85 | $399.76 |
| Jun-83 | $135.03 | $402.07 |
| Jul-83 | $140.54 | $416.80 |
| Aug-83 | $152.75 | $451.66 |
| Sep-83 | $147.63 | $434.35 |
| Oct-83 | $148.02 | $434.21 |
| Nov-83 | $146.84 | $429.89 |
| Dec-83 | $142.91 | $417.97 |
| Jan-84 | $142.12 | $413.22 |
| Feb-84 | $137.00 | $396.38 |
| Mar-84 | $146.06 | $421.77 |
| Apr-84 | $148.02 | $425.36 |
| May-84 | $146.06 | $418.51 |
| Jun-84 | $146.84 | $419.53 |
| Jul-84 | $142.51 | $405.59 |
| Aug-84 | $138.58 | $392.90 |
| Sep-84 | $130.31 | $367.69 |
| Oct-84 | $121.25 | $341.15 |
| Nov-84 | $117.32 | $330.10 |
| Dec-84 | $113.77 | $320.11 |
| Jan-85 | $119.68 | $336.10 |
| Feb-85 | $119.68 | $334.51 |
| Mar-85 | $120.47 | $335.45 |
| Apr-85 | $120.07 | $332.78 |
| May-85 | $116.92 | $322.84 |
| Jun-85 | $116.14 | $319.79 |
| Jul-85 | $114.96 | $315.95 |
| Aug-85 | $105.51 | $289.45 |
| Sep-85 | $101.96 | $278.93 |
| Oct-85 | $97.63 | $266.10 |
| Nov-85 | $106.29 | $288.91 |
| Dec-85 | $108.66 | $294.54 |
| Jan-86 | $107.08 | $289.46 |
| Feb-86 | $104.33 | $282.80 |
| Mar-86 | $100.78 | $274.44 |
| Apr-86 | $101.57 | $277.10 |
| May-86 | $105.51 | $287.05 |
| Jun-86 | $104.72 | $283.34 |
| Jul-86 | $83.46 | $225.82 |
| Aug-86 | $75.19 | $203.07 |
| Sep-86 | $66.14 | $177.82 |
| Oct-86 | $65.35 | $175.54 |
| Nov-86 | $69.29 | $185.95 |
| Dec-86 | $70.08 | $187.90 |
| Jan-87 | $68.11 | $181.47 |
| Feb-87 | $66.93 | $177.69 |
| Mar-87 | $71.65 | $189.37 |
| Apr-87 | $74.41 | $195.62 |
| May-87 | $80.70 | $211.40 |
| Jun-87 | $80.31 | $209.64 |
| Jul-87 | $76.37 | $198.83 |
| Aug-87 | $71.26 | $184.55 |
| Sep-87 | $72.83 | $187.63 |
| Oct-87 | $78.74 | $202.33 |
| Nov-87 | $81.89 | $210.24 |
| Dec-87 | $83.07 | $213.27 |
| Jan-88 | $86.61 | $221.78 |
| Feb-88 | $87.40 | $223.23 |
| Mar-88 | $90.55 | $230.28 |
| Apr-88 | $89.76 | $227.10 |
| May-88 | $90.15 | $227.31 |
| Jun-88 | $120.07 | $301.47 |
| Jul-88 | $126.77 | $316.95 |
| Aug-88 | $118.89 | $296.00 |
| Sep-88 | $121.25 | $299.86 |
| Oct-88 | $121.25 | $298.86 |
| Nov-88 | $113.38 | $279.23 |
| Dec-88 | $117.32 | $288.46 |
| Jan-89 | $118.50 | $289.91 |
| Feb-89 | $117.58 | $286.48 |
| Mar-89 | $118.89 | $288.02 |
| Apr-89 | $115.35 | $277.62 |
| May-89 | $117.32 | $280.77 |
| Jun-89 | $113.38 | $270.68 |
| Jul-89 | $107.48 | $255.98 |
| Aug-89 | $101.18 | $240.59 |
| Sep-89 | $103.14 | $244.46 |
| Oct-89 | $106.29 | $250.73 |
| Nov-89 | $108.66 | $255.71 |
| Dec-89 | $108.66 | $255.30 |
| Jan-90 | $105.90 | $246.28 |
| Feb-90 | $106.29 | $246.02 |
| Mar-90 | $109.84 | $252.86 |
| Apr-90 | $118.50 | $272.37 |
| May-90 | $121.25 | $278.05 |
| Jun-90 | $120.07 | $273.86 |
| Jul-90 | $114.96 | $261.20 |
| Aug-90 | $109.84 | $247.29 |
| Sep-90 | $102.36 | $228.54 |
| Oct-90 | $100.00 | $221.93 |
| Nov-90 | $100.00 | $221.43 |
| Dec-90 | $102.36 | $226.66 |
| Jan-91 | $105.51 | $232.24 |
| Feb-91 | $106.29 | $233.61 |
| Mar-91 | $109.05 | $239.33 |
| Apr-91 | $110.23 | $241.56 |
| May-91 | $105.74 | $231.03 |
| Jun-91 | $105.11 | $228.98 |
| Jul-91 | $105.73 | $229.99 |
| Aug-91 | $110.12 | $238.84 |
| Sep-91 | $108.85 | $235.06 |
| Oct-91 | $109.70 | $236.55 |
| Nov-91 | $106.49 | $228.96 |
| Dec-91 | $106.91 | $229.69 |
| Jan-92 | $109.31 | $234.51 |
| Feb-92 | $113.62 | $242.88 |
| Mar-92 | $117.00 | $248.85 |
| Apr-92 | $108.52 | $230.48 |
| May-92 | $109.64 | $232.52 |
| Jun-92 | $110.90 | $234.36 |
| Jul-92 | $102.75 | $216.67 |
| Aug-92 | $96.96 | $203.88 |
| Sep-92 | $98.05 | $205.59 |
| Oct-92 | $95.11 | $198.72 |
| Nov-92 | $94.48 | $197.13 |
| Dec-92 | $94.61 | $197.54 |
| Jan-93 | $94.21 | $195.74 |
| Feb-93 | $94.38 | $195.41 |
| Mar-93 | $97.14 | $200.42 |
| Apr-93 | $100.55 | $206.88 |
| May-93 | $98.59 | $202.56 |
| Jun-93 | $92.76 | $190.32 |
| Jul-93 | $101.25 | $207.74 |
| Aug-93 | $100.31 | $205.24 |
| Sep-93 | $100.90 | $206.03 |
| Oct-93 | $106.53 | $216.63 |
| Nov-93 | $116.67 | $237.08 |
| Dec-93 | $121.79 | $247.49 |
| Jan-94 | $127.23 | $257.83 |
| Feb-94 | $123.22 | $248.86 |
| Mar-94 | $119.40 | $240.32 |
| Apr-94 | $113.23 | $227.59 |
| May-94 | $109.59 | $220.13 |
| Jun-94 | $112.16 | $224.53 |
| Jul-94 | $97.83 | $195.31 |
| Aug-94 | $95.99 | $190.87 |
| Sep-94 | $97.51 | $193.37 |
| Oct-94 | $96.48 | $191.20 |
| Nov-94 | $95.47 | $188.95 |
| Dec-94 | $102.49 | $202.84 |
| Jan-95 | $106.96 | $210.84 |
| Feb-95 | $106.69 | $209.47 |
| Mar-95 | $109.70 | $214.67 |
| Apr-95 | $109.30 | $213.19 |
| May-95 | $111.97 | $217.96 |
| Jun-95 | $119.86 | $232.86 |
| Jul-95 | $126.99 | $246.72 |
| Aug-95 | $126.44 | $245.00 |
| Sep-95 | $130.48 | $252.34 |
| Oct-95 | $140.86 | $271.53 |
| Nov-95 | $143.95 | $277.66 |
| Dec-95 | $148.65 | $286.91 |
| Jan-96 | $156.13 | $299.60 |
| Feb-96 | $164.81 | $315.23 |
| Mar-96 | $184.86 | $351.76 |
| Apr-96 | $190.37 | $360.86 |
| May-96 | $204.02 | $385.99 |
| Jun-96 | $197.55 | $373.51 |
| Jul-96 | $197.80 | $373.27 |
| Aug-96 | $185.50 | $349.39 |
| Sep-96 | $145.39 | $272.98 |
| Oct-96 | $127.85 | $239.29 |
| Nov-96 | $117.74 | $219.95 |
| Dec-96 | $117.69 | $219.85 |
| Jan-97 | $118.36 | $220.41 |
| Feb-97 | $121.67 | $225.86 |
| Mar-97 | $127.60 | $236.28 |
| Apr-97 | $124.40 | $230.07 |
| May-97 | $118.77 | $219.79 |
| Jun-97 | $112.05 | $207.10 |
| Jul-97 | $106.06 | $195.78 |
| Aug-97 | $112.92 | $208.06 |
| Sep-97 | $112.24 | $206.29 |
| Oct-97 | $120.36 | $220.67 |
| Nov-97 | $117.22 | $215.04 |
| Dec-97 | $113.45 | $208.39 |
| Jan-98 | $114.71 | $210.31 |
| Feb-98 | $113.38 | $207.48 |
| Mar-98 | $114.21 | $208.62 |
| Apr-98 | $107.12 | $195.31 |
| May-98 | $106.10 | $193.09 |
| Jun-98 | $104.23 | $189.45 |
| Jul-98 | $100.51 | $182.47 |
| Aug-98 | $87.86 | $159.31 |
| Sep-98 | $86.31 | $156.31 |
| Oct-98 | $95.53 | $172.58 |
| Nov-98 | $98.12 | $177.26 |
| Dec-98 | $95.76 | $173.10 |
| Jan-99 | $97.44 | $175.71 |
| Feb-99 | $94.19 | $169.64 |
| Mar-99 | $96.18 | $172.70 |
| Apr-99 | $94.13 | $167.80 |
| May-99 | $92.49 | $164.88 |
| Jun-99 | $93.65 | $166.94 |
| Jul-99 | $83.99 | $149.28 |
| Aug-99 | $85.65 | $151.86 |
| Sep-99 | $86.47 | $152.58 |
| Oct-99 | $85.80 | $151.13 |
| Nov-99 | $85.43 | $150.39 |
| Dec-99 | $87.18 | $153.47 |
| Jan-00 | $93.29 | $163.74 |
| Feb-00 | $95.15 | $166.02 |
| Mar-00 | $95.05 | $164.49 |
| Apr-00 | $95.20 | $164.66 |
| May-00 | $96.35 | $166.45 |
| Jun-00 | $84.33 | $144.92 |
| Jul-00 | $75.27 | $129.05 |
| Aug-00 | $75.58 | $129.59 |
| Sep-00 | $80.43 | $137.19 |
| Oct-00 | $85.03 | $144.78 |
| Nov-00 | $89.17 | $151.75 |
| Dec-00 | $97.56 | $166.12 |
| Jan-01 | $95.15 | $161.00 |
| Feb-01 | $91.97 | $155.00 |
| Mar-01 | $90.25 | $151.75 |
| Apr-01 | $87.99 | $147.37 |
| May-01 | $84.09 | $140.20 |
| Jun-01 | $83.31 | $138.67 |
| Jul-01 | $91.73 | $153.11 |
| Aug-01 | $93.14 | $155.47 |
| Sep-01 | $90.08 | $149.68 |
| Oct-01 | $86.56 | $144.32 |
| Nov-01 | $89.54 | $149.54 |
| Dec-01 | $91.88 | $154.06 |
| Jan-02 | $91.98 | $153.88 |
| Feb-02 | $90.82 | $151.34 |
| Mar-02 | $89.61 | $148.49 |
| Apr-02 | $87.13 | $143.57 |
| May-02 | $90.27 | $148.75 |
| Jun-02 | $94.09 | $154.96 |
| Jul-02 | $98.69 | $162.35 |
| Aug-02 | $108.93 | $178.60 |
| Sep-02 | $114.14 | $186.83 |
| Oct-02 | $109.70 | $179.27 |
| Nov-02 | $108.93 | $178.01 |
| Dec-02 | $106.96 | $175.18 |
| Jan-03 | $106.14 | $173.07 |
| Feb-03 | $105.85 | $171.28 |
| Mar-03 | $105.60 | $169.85 |
| Apr-03 | $105.46 | $170.00 |
| May-03 | $107.49 | $173.55 |
| Jun-03 | $107.33 | $173.10 |
| Jul-03 | $96.81 | $155.97 |
| Aug-03 | $100.66 | $161.56 |
| Sep-03 | $104.08 | $166.50 |
| Oct-03 | $105.39 | $168.78 |
| Nov-03 | $108.48 | $174.20 |
| Dec-03 | $111.16 | $178.70 |
| Jan-04 | $115.52 | $184.80 |
| Feb-04 | $123.54 | $196.57 |
| Mar-04 | $127.85 | $202.13 |
| Apr-04 | $133.50 | $210.39 |
| May-04 | $128.22 | $200.89 |
| Jun-04 | $123.32 | $192.60 |
| Jul-04 | $104.85 | $164.02 |
| Aug-04 | $104.05 | $162.68 |
| Sep-04 | $97.87 | $152.69 |
| Oct-04 | $93.79 | $145.56 |
| Nov-04 | $93.75 | $145.42 |
| Dec-04 | $95.39 | $148.51 |
| Jan-05 | $96.25 | $149.54 |
| Feb-05 | $94.14 | $145.42 |
| Mar-05 | $99.88 | $153.09 |
| Apr-05 | $96.28 | $146.59 |
| May-05 | $95.42 | $145.43 |
| Jun-05 | $97.10 | $147.91 |
| Jul-05 | $107.52 | $163.03 |
| Aug-05 | $101.67 | $153.37 |
| Sep-05 | $96.35 | $143.59 |
| Oct-05 | $101.94 | $151.62 |
| Nov-05 | $95.37 | $143.00 |
| Dec-05 | $102.14 | $153.77 |
| Jan-06 | $102.65 | $153.37 |
| Feb-06 | $107.13 | $159.74 |
| Mar-06 | $105.25 | $156.07 |
| Apr-06 | $107.72 | $158.39 |
| May-06 | $110.65 | $161.89 |
| Jun-06 | $109.40 | $159.75 |
| Jul-06 | $113.99 | $165.96 |
| Aug-06 | $116.59 | $169.41 |
| Sep-06 | $121.75 | $177.78 |
| Oct-06 | $142.17 | $208.73 |
| Nov-06 | $164.54 | $241.93 |
| Dec-06 | $160.38 | $235.46 |
| Jan-07 | $164.77 | $241.17 |
| Feb-07 | $177.35 | $258.21 |
| Mar-07 | $170.51 | $246.01 |
| Apr-07 | $152.75 | $218.96 |
| May-07 | $160.23 | $228.29 |
| Jun-07 | $165.25 | $234.99 |
| Jul-07 | $146.84 | $208.86 |
| Aug-07 | $151.17 | $215.41 |
| Sep-07 | $159.44 | $226.57 |
| Oct-07 | $164.16 | $232.78 |
| Nov-07 | $171.25 | $241.40 |
| Dec-07 | $180.25 | $254.26 |
| Jan-08 | $206.66 | $290.07 |
| Feb-08 | $220.07 | $308.00 |
| Mar-08 | $234.36 | $325.18 |
| Apr-08 | $246.44 | $339.88 |
| May-08 | $243.46 | $332.97 |
| Jun-08 | $287.11 | $388.75 |
| Jul-08 | $265.34 | $357.39 |
| Aug-08 | $235.03 | $317.84 |
| Sep-08 | $233.85 | $316.68 |
| Oct-08 | $183.06 | $250.43 |
| Nov-08 | $163.77 | $228.42 |
| Dec-08 | $158.26 | $223.04 |
| Jan-09 | $172.83 | $242.52 |
| Feb-09 | $163.38 | $228.12 |
| Mar-09 | $164.56 | $229.21 |
| Apr-09 | $168.50 | $234.11 |
| May-09 | $179.91 | $249.25 |
| Jun-09 | $179.52 | $246.59 |
| Jul-09 | $151.57 | $208.53 |
| Aug-09 | $151.96 | $208.60 |
| Sep-09 | $150.39 | $206.31 |
| Oct-09 | $167.31 | $229.30 |
| Nov-09 | $171.64 | $235.07 |
| Dec-09 | $164.56 | $225.77 |
| Jan-10 | $167.31 | $228.76 |
| Feb-10 | $161.80 | $221.17 |
| Mar-10 | $159.05 | $216.53 |
| Apr-10 | $157.08 | $213.47 |
| May-10 | $163.38 | $221.86 |
| Jun-10 | $152.75 | $207.63 |
| Jul-10 | $163.76 | $222.55 |
| Aug-10 | $175.58 | $238.28 |
| Sep-10 | $205.89 | $279.26 |
| Oct-10 | $235.81 | $319.44 |
| Nov-10 | $238.18 | $322.51 |
| Dec-10 | $250.38 | $338.45 |
| Jan-11 | $264.95 | $356.45 |
| Feb-11 | $292.90 | $392.12 |
| Mar-11 | $290.54 | $385.20 |
| Apr-11 | $319.27 | $420.58 |
| May-11 | $307.86 | $403.66 |
| Jun-11 | $310.61 | $407.70 |
| Jul-11 | $300.77 | $394.43 |
| Aug-11 | $310.22 | $405.71 |
| Sep-11 | $295.26 | $385.56 |
| Oct-11 | $274.79 | $359.57 |
| Nov-11 | $274.39 | $359.35 |
| Dec-11 | $258.65 | $339.57 |
| Jan-12 | $272.84 | $356.63 |
| Feb-12 | $279.46 | $363.68 |
| Mar-12 | $280.69 | $362.53 |
| Apr-12 | $274.00 | $352.82 |
| May-12 | $269.28 | $347.15 |
| Jun-12 | $267.31 | $345.12 |
| Jul-12 | $333.05 | $430.70 |
| Aug-12 | $331.99 | $426.95 |
| Sep-12 | $320.85 | $410.79 |
| Oct-12 | $321.24 | $411.45 |
| Nov-12 | $321.64 | $413.92 |
| Dec-12 | $308.65 | $398.28 |
| Jan-13 | $303.13 | $390.00 |
| Feb-13 | $302.74 | $386.34 |
| Mar-13 | $309.04 | $393.35 |
| Apr-13 | $279.91 | $356.64 |
| May-13 | $295.54 | $375.89 |
| Jun-13 | $298.41 | $378.63 |
| Jul-13 | $279.51 | $354.51 |
| Aug-13 | $238.74 | $302.44 |
| Sep-13 | $207.41 | $262.44 |
| Oct-13 | $201.73 | $255.91 |
| Nov-13 | $199.13 | $253.13 |
| Dec-13 | $197.39 | $250.94 |
| Jan-14 | $198.06 | $250.86 |
| Feb-14 | $209.32 | $264.15 |
| Mar-14 | $222.33 | $278.77 |
| Apr-14 | $222.36 | $277.89 |
| May-14 | $217.30 | $270.62 |
| Jun-14 | $202.39 | $251.58 |
| Jul-14 | $182.73 | $227.23 |
| Aug-14 | $176.42 | $219.75 |
| Sep-14 | $163.06 | $202.96 |
| Oct-14 | $163.12 | $203.55 |
| Nov-14 | $178.74 | $224.25 |
| Dec-14 | $178.73 | $225.51 |
| Jan-15 | $174.71 | $221.48 |
| Feb-15 | $173.70 | $219.25 |
| Mar-15 | $174.23 | $218.62 |
| Apr-15 | $172.05 | $215.45 |
| May-15 | $166.29 | $207.18 |
| Jun-15 | $166.72 | $206.99 |
| Jul-15 | $179.60 | $222.96 |
| Aug-15 | $162.59 | $202.13 |
| Sep-15 | $165.62 | $206.22 |
| Oct-15 | $171.39 | $213.50 |
| Nov-15 | $166.16 | $207.42 |
| Dec-15 | $163.95 | $205.37 |
| Jan-16 | $161.03 | $201.38 |
| Feb-16 | $159.68 | $199.52 |
| Mar-16 | $159.14 | $198.00 |
| Apr-16 | $164.41 | $203.59 |
| May-16 | $168.96 | $208.38 |
| Jun-16 | $179.87 | $221.11 |
| Jul-16 | $161.76 | $199.17 |
| Aug-16 | $150.15 | $184.70 |
| Sep-16 | $148.43 | $182.15 |
| Oct-16 | $152.26 | $186.62 |
| Nov-16 | $151.80 | $186.34 |
| Dec-16 | $152.45 | $187.08 |
| Jan-17 | $159.99 | $195.20 |
| Feb-17 | $162.86 | $198.07 |
| Mar-17 | $158.96 | $193.17 |
| Apr-17 | $156.44 | $189.55 |
| May-17 | $158.59 | $191.99 |
| Jun-17 | $157.93 | $191.02 |
| Jul-17 | $157.51 | $190.64 |
| Aug-17 | $148.50 | $179.20 |
| Sep-17 | $147.29 | $176.80 |
| Oct-17 | $148.62 | $178.51 |
| Nov-17 | $148.70 | $178.60 |
| Dec-17 | $148.98 | $179.05 |
| Jan-18 | $155.84 | $186.28 |
| Feb-18 | $163.36 | $194.38 |
| Mar-18 | $172.00 | $204.20 |
| Apr-18 | $175.60 | $207.65 |
| May-18 | $179.09 | $210.90 |
| Jun-18 | $165.07 | $194.08 |
| Jul-18 | $156.46 | $183.95 |
| Aug-18 | $162.37 | $190.79 |
| Sep-18 | $154.80 | $181.68 |
| Oct-18 | $160.26 | $187.76 |
| Nov-18 | $160.69 | $188.89 |
| Dec-18 | $167.44 | $197.46 |
| Jan-19 | $166.74 | $196.26 |
| Feb-19 | $169.52 | $198.69 |
| Mar-19 | $166.22 | $193.73 |
| Apr-19 | $161.49 | $187.23 |
| May-19 | $171.08 | $197.92 |
| Jun-19 | $195.08 | $225.65 |
| Jul-19 | $189.42 | $218.73 |
| Aug-19 | $163.59 | $188.92 |
| Sep-19 | $157.26 | $181.46 |
| Oct-19 | $167.15 | $192.44 |
| Nov-19 | $166.33 | $191.59 |
| Dec-19 | $166.96 | $192.50 |
| Jan-20 | $171.79 | $197.30 |
| Feb-20 | $168.71 | $193.23 |
| Mar-20 | $162.42 | $186.43 |
| Apr-20 | $146.91 | $169.77 |
| May-20 | $143.91 | $166.30 |
| Jun-20 | $147.99 | $170.08 |
| Jul-20 | $152.55 | $174.44 |
| Aug-20 | $149.34 | $170.23 |
| Sep-20 | $166.08 | $189.05 |
| Oct-20 | $186.75 | $212.49 |
| Nov-20 | $190.38 | $216.75 |
| Dec-20 | $198.77 | $226.09 |
| Jan-21 | $234.47 | $265.57 |
| Feb-21 | $245.24 | $276.25 |
| Mar-21 | $245.17 | $274.23 |
| Apr-21 | $268.23 | $297.58 |
| May-21 | $305.31 | $336.02 |
| Jun-21 | $292.56 | $319.03 |
| Jul-21 | $278.43 | $302.17 |
| Aug-21 | $256.61 | $277.91 |
| Sep-21 | $235.62 | $254.49 |
| Oct-21 | $239.65 | $256.71 |
| Nov-21 | $248.72 | $265.12 |
| Dec-21 | $264.54 | $281.12 |
| Jan-22 | $276.62 | $291.50 |
| Feb-22 | $292.62 | $305.57 |
| Mar-22 | $335.53 | $345.77 |
| Apr-22 | $348.17 | $356.80 |
| May-22 | $344.84 | $349.54 |
| Jun-22 | $335.71 | $335.67 |
| Jul-22 | $312.68 | $312.68 |
Corn Prices Courtesy of Indexmundi
See the article on the Inflation implications of Ethanol for more information.
You might also like:
- Inflation-Adjusted Price of Oil Chart
- Annual average Crude Oil Prices in Table form
- Price comparison of Oil vs. Gold
- Inflation Adjusted Gasoline Prices
- Inflation Adjusted NYSE Stock Index