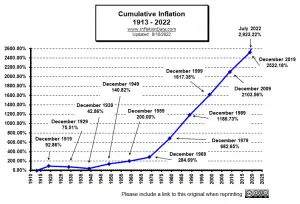
How Much Inflation have we had since 1913? Just like compound interest, "compound inflation" grows faster and faster. So, even though the average annual inflation since 1913 has been "only" 3.24% PER YEAR. After over 100 years, the total cumulative inflation becomes astronomical. See Average Annual Inflation Rates by Decade to see how each decade stacked up. As you can see from the chart below, compounding something for over 100 years at 3.24% will result in well over 2000% inflation. The Consumer Price index (CPI-U) for January 1913 was 9.8. The CPI-U for July 2022 was 296.276. This means that something that cost $9.80 in January 1913 would cost $296.28 in July of … [Read more...]
Long Term Inflation Charts Updated
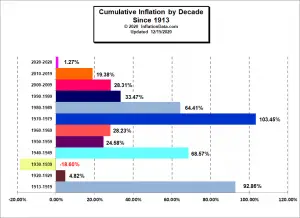
Average Inflation by Decade We've updated the long term inflation charts that appear around the site. These charts include Average Annual Inflation by decade i.e. what the average inflation rate was during the 1990s vs. the 1970s or the 2000s, etc. You can find these charts and more in-depth commentary in the following places: Average Annual Inflation Rates by Decade Total Inflation by Decade US Long Term Average Inflation Cumulative Inflation by Decade This is the amount of inflation experienced during … [Read more...]
Long Term U.S. Inflation
We have updated the charts on long Term Inflation, including Average Annual Inflation by decade, Cumulative Inflation by Decade and Cumulative Inflation since 1913. The Chart below shows the Annual Inflation Rates for each decade. Each bar represents the average Annual Inflation for that decade (not the total cumulative inflation for that 10 year period but how much it increased each year on average during that decade). Do you know: 1) Average Annual Inflation since 1913: 2) That deflation in the "Roaring 20's" was almost as bad as in the "Great Depression" of the 1930's? 3) How Crop Subsidies affected farm prices in the 1920's and 30's? 4) How the proliferation of … [Read more...]


