
The 1980s began with the world in a major recession, and the U.S. had massive Inflation and Unemployment. In addition to economic woes, Jimmy Carter was dealing with the 444-day Iranian hostage crisis, which began on November 4. 1979, and culminated precisely at the conclusion of Reagan’s inaugural address on January 20, 1981.
Reagan was a staunch believer in laissez-faire capitalism and a follower of “Austrian economics”. He emphasized reduced government intervention, lower taxes, and deregulation of the stock markets, which led to an economic revival in the mid-to-late 80s. Over the decade, the New York Stock Exchange nearly quadrupled from just over 500 to almost 2000. At the same time, the Consumer Price Index increased 62% from 77.8 to 126.1, so the stock market outpaced Inflation by about three-fold.
The eruption of Mount St. Helens on May 18, 1980, may have been the turning point where things started to get better.

Mt. St. Helens, Washington
In January 1980, Inflation was 13.91%, and Unemployment was 6.3%. Inflation peaked in April 1980 at 14.76% and fell to “only” 6.51% the following April. By December 1989, Inflation had decreased drastically to 4.65%, and Unemployment had declined to 5.4%.
At the beginning of the decade, the American auto industry suffered partially due to the poor economy. Unions began a “Buy American” campaign which helped a little, but Chrysler and American Motors were near bankruptcy.
In the 1980s, the Japanese began producing cars on modern, easily customizable assembly lines. Customization allowed the Japanese to correct quality defects rapidly, while American assembly lines were more difficult to upgrade. Slow correction of defects led to the widespread perception that imports were of higher quality than American-made vehicles.
The automakers recovered with the economy by 1983, and in 1985 auto sales in the United States hit a new record. But Japanese cars continued to control a significant portion of the auto market and even began manufacturing vehicles in the U.S. to avoid tariffs.
In 1989 Canada and the United States agreed to a “Free Trade Agreement” further facilitating trade between the two North American countries by eliminating tariffs. NAFTA superseded the Free Trade Agreement in 1994, which added Mexico to the free trade zone.
In April 1981, the space shuttle Columbia launched as the first manned American space flight since the joint Apollo-Soyuz test project ended in 1975. The shuttle program progressed smoothly from there, with three more orbiters entering service in 1983–1985. But that all came to an end with the space shuttle Challenger crash on January 28, 1986.
Personal computers experienced explosive growth in the ’80s, ushering in the “Digital Age” and spawning a full-fledged industry. IBM launched the IBM PC in 1981, which became the dominant computer for professional users, and in 1984 Apple introduced the first commercially successful personal computer to use a graphical user interface and mouse and called it the “Macintosh”. Together they set the stage for economic growth on a massive scale.
The Misery Index
The “misery index” was created as a simple measure of the well-being of the general populous by economist Arthur Okun in the 1960s by simply adding the unemployment rate on top of the inflation rate. The 1970’s coined the term “stagflation,” which was a condition where the economy stagnates despite rampant Inflation.
Although starting badly, the 1980s was a time of falling Inflation and an improving misery index.

Reagan’s belief in laissez-faire capitalism led him to reduce government intervention, lower taxes, and deregulate markets, leading to an economic revival in the mid-to the late 80s. He also promoted trickle-down economics, the economic idea that taxes on businesses and the wealthy in society should be reduced as a means to stimulate business investment in the short term and benefit society at large over the long term.
It appears that Reagan was successful because although Inflation in the 1980s increased 62%, with the Consumer Price Index going from 77.8 to 126.1, the stock market outpaced Inflation by about three-fold.

The Consumer Price Index CPI from 1980 – 1989
| Year | Jan- | Feb- | Mar- | Apr- | May- | Jun- | Jul- | Aug- | Sep- | Oct- | Nov- | Dec- |
| 1980 | 77.8 | 78.9 | 80.1 | 81.0 | 81.8 | 82.7 | 82.7 | 83.3 | 84.0 | 84.8 | 85.5 | 86.3 |
| 1981 | 87.0 | 87.9 | 88.5 | 89.1 | 89.8 | 90.6 | 90.6 | 91.6 | 93.2 | 93.4 | 93.7 | 94.0 |
| 1982 | 94.3 | 94.6 | 94.5 | 94.9 | 9.8 | 97.0 | 97.0 | 97.5 | 97.9 | 98.2 | 98.0 | 97.6 |
| 1983 | 97.8 | 97.9 | 97.9 | 98.6 | 99.2 | 99.5 | 99.5 | 99.9 | 100.7 | 101.0 | 101.2 | 101.3 |
| 1984 | 101.9 | 102.4 | 102.6 | 103.1 | 103.4 | 103.7 | 103.7 | 104.0 | 105.0 | 105.3 | 105.3 | 105.3 |
| 1985 | 105.5 | 106.0 | 106.4 | 106.9 | 107.3 | 107.6 | 107.6 | 107.8 | 108.3 | 108.7 | 109.0 | 109.3 |
| 1986 | 109.6 | 109.3 | 108.8 | 108.8 | 108.9 | 109.5 | 109.5 | 109.5 | 110.2 | 110.3 | 110.4 | 110.5 |
| 1987 | 111.2 | 111.6 | 112.1 | 112.1 | 113.1 | 113.5 | 113.5 | 113.8 | 115.0 | 115.3 | 115.4 | 115.4 |
| 1988 | 115.7 | 116.0 | 116.5 | 116.5 | 117.5 | 118.0 | 118.0 | 118.5 | 119.8 | 120.2 | 120.3 | 120.5 |
| 1989 | 121.1 | 121.6 | 122.3 | 122.3 | 123.8 | 124.1 | 124.1 | 124.4 | 125.0 | 125.6 | 125.9 | 126.1 |
Annual Inflation from 1980 – 1989
| Year | Jan | Feb | Mar | Apr | May | Jun | Jul | Aug | Sep | Oct | Nov | Dec |
| 1980 | 13.91% | 14.18% | 14.18% | 14.76% | 14.41% | 14.38% | 13.13% | 12.87% | 12.60% | 12.77% | 12.65% | 12.52% |
| 1981 | 11.83% | 11.41% | 10.49% | 10.00% | 9.78% | 9.55% | 10.76% | 10.80% | 10.95% | 10.14% | 9.59% | 8.92% |
| 1982 | 8.39% | 7.62% | 6.78% | 6.51% | 6.68% | 7.06% | 6.44% | 5.85% | 5.04% | 5.14% | 4.59% | 3.83% |
| 1983 | 3.71% | 3.49% | 3.60% | 3.90% | 3.55% | 2.58% | 2.46% | 2.56% | 2.86% | 2.85% | 3.27% | 3.79% |
| 1984 | 4.19% | 4.60% | 4.80% | 4.56% | 4.23% | 4.22% | 4.20% | 4.29% | 4.27% | 4.26% | 4.05% | 3.95% |
| 1985 | 3.53% | 3.52% | 3.70% | 3.69% | 3.77% | 3.76% | 3.55% | 3.35% | 3.14% | 3.23% | 3.51% | 3.80% |
| 1986 | 3.89% | 3.11% | 2.26% | 1.59% | 1.49% | 1.77% | 1.58% | 1.57% | 1.75% | 1.47% | 1.28% | 1.10% |
| 1987 | 1.46% | 2.10% | 3.03% | 3.78% | 3.86% | 3.65% | 3.93% | 4.28% | 4.36% | 4.53% | 4.53% | 4.43% |
| 1988 | 4.05% | 3.94% | 3.93% | 3.90% | 3.89% | 3.96% | 4.13% | 4.02% | 4.17% | 4.25% | 4.25% | 4.42% |
| 1989 | 4.67% | 4.83% | 4.98% | 5.12% | 5.36% | 5.17% | 4.98% | 4.71% | 4.34% | 4.49% | 4.66% | 4.65% |
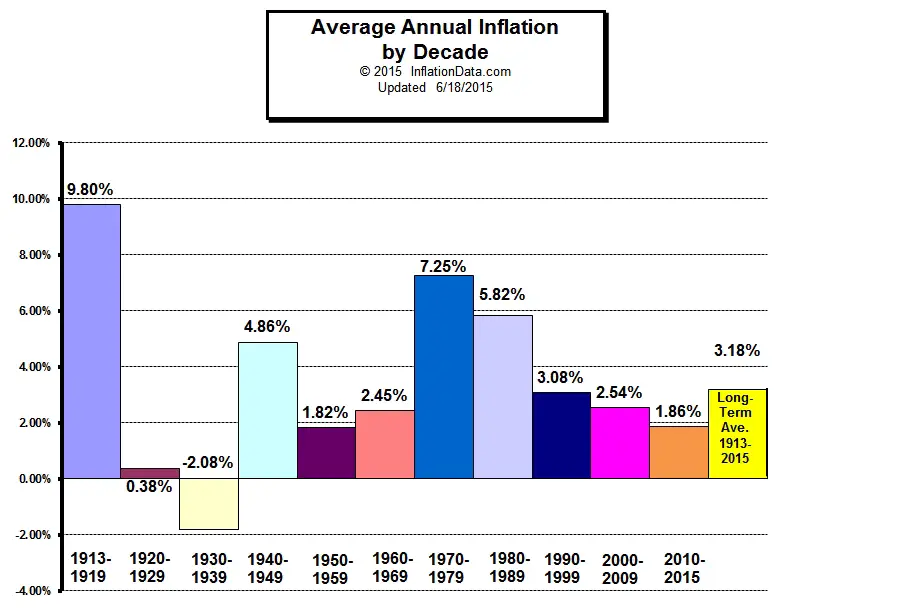
From the Average Annual Inflation by Decade chart, we can see that the average Inflation for the 1980′s was 5.82%, which is still considerably above the long-term average of 3.18%.
Click Image for more information
Inflation Chart 1980- 1989
The following chart shows the inflation rates during the period from 1980-1989.
See Also:
 |
 |
 |
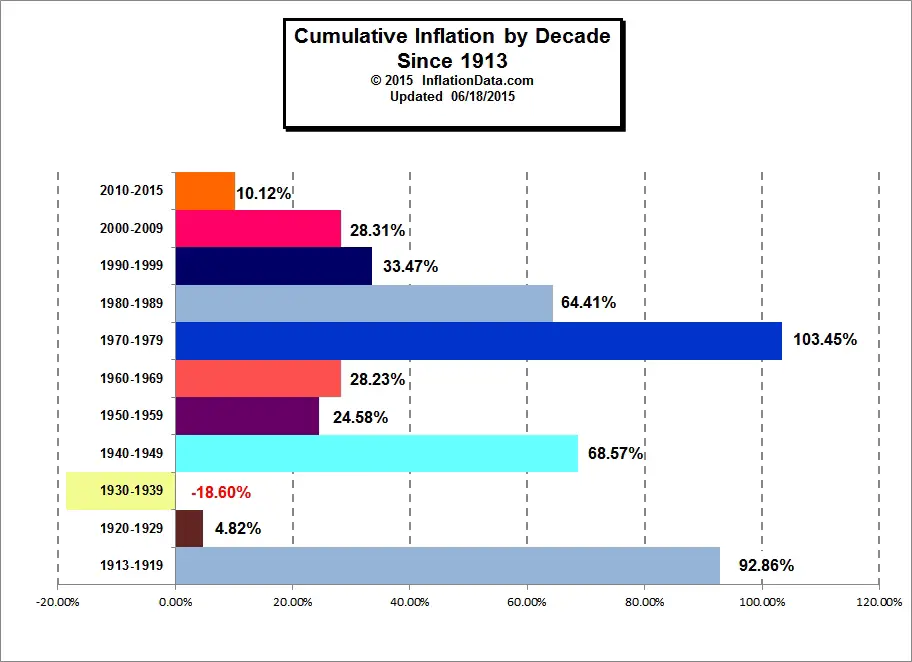
| Average Annual Inflation by Decade | Total Inflation by Decade | Total Cumulative Inflation |
- Inflation and Consumer Price Index- Decade Commentary
- WWI – The beginning of the of the CPI the Inflationary period 1913 – 1919
- The “Roaring Twenties” Inflation and Deflation 1920-1929
- The Great Depression and the Deflationary 1930′s– 1930-1939
- World War II — the volatile 1940′s– High and Low Inflation 1940-1949
- The 1950′s “Happy Days”– Inflation and CPI 1950-1959
- The 1960′s the age of possibility– Low Inflation 1960-1969
- The Inflationary 1970’s Inflation and CPI 1970-1979
- The Reagan Era Lower Inflation 1980-1989 – This Page
- The Decade of Free Enterprise Inflation 1990-1999
Let’s hope the latest generation of retirees can press the government on all levels to benefit them in their retirement years. With so many baby boomer voters, politicians will have to take them into consideration to get the vote. *Let’s hope*
Reagan, like many politicians was a hypocrite, all talk and little action. As examples, the income tax is an abomination to all those who truly believes in laissez-faire capitalism. Of course, Reagan took it to the next level by being the first President in history to tax the Social Security benefits of retirees, mostly those who were forced to take early retirement at age 62 to survive at the unconscionable rate of 50% on income over a measly $17,400 annually. Yes, he may have cut some overall tax rates when he signed the 1986 Internal Revenue Code and its tax on labor which is not even income according to many Supreme Court cases, but no one talks about the changes in allowable deductions. He also lied to the American people during his first campaign about cutting the Federal budget, every time to great rounds of applause, only to make the military industrial complex exceedingly profitable by substantially raising his defense budget which took the overall budget well over his predecessors jimmy Carters budget. Politicians will always do what the ruling class tells them to do, as long as the people sit back and do nothing and it doesn’t matter which side of the aisle they are on. NOTE: Not one President since then has increased the taxable base income for retirees to the same rate as the CPI to keep pace with inflation. The bureaucracy is a much as a part of the predatory class as the politicians who constantly lie to us telling how great they well be in helping the majority, as they steal from us via over 120 different taxes and regulatory fees while at the same time debasing the currency. Trust me I’m from the government and I’m here to help you.
Could you provide me with a cumulative cost-of-living increase in the USA from 1949 to 2015. I plan to reimburse my alma mater for the inflation-corrected value of a $200 student loan received in 1949.
The easiest way to calculate the inflation from any day to any other day since 1913 is to use our cumulative inflation Calculator. Simply enter the starting amount and the two dates. It is located here:
https://inflationdata.com/Inflation/Inflation_Calculators/Cumulative_Inflation_Calculator.aspx