
During the 1960s and 1970s, increasing exports played a key role in Japanese economic expansion, and throughout the 1970s, Japan had the world’s third largest gross national product (GNP)—just behind the United States and Soviet Union. In 1980, per capita GNP was US$9,068 and by 1990 it had grown to US$23,801.
During the 1980s, the Japanese were at the forefront of the shift to computer processing, with an emphasis on telecommunications and manufacturing automation. Their auto manufacturers rapidly became the most automated and used a modular system that allowed for rapid changes in production allowing them to quickly remedy defects and so they became known for producing quality cars. Thus the Japanese economy shifted its emphasis away from primary and secondary activities like agriculture and mining and toward automation, and computers.
The Lost Decade
Originally, the period from 1991 through 2000 was called the “Lost Decade” because asset prices collapsed during this period, but it happened gradually rather than catastrophically. But when the next decade showed continued low prices the lost decade became the lost two decades.
However, as I’ve said many times deflation per se is not bad. And although the strong economic growth of the 1970s ended abruptly at the start of the 1990s due to actions by the Bank of Japan (BOJ) and the Stock Market crashed and unemployment rose, the impact on everyday life was muted, however due to falling prices. Unemployment rates were high, but not at a crisis level. The impact on the average Japanese family was limited, due to their traditional emphasis on frugality and saving, so their standard of living did not deteriorate significantly from what it was in the 1980s. As a matter of fact, some interpretations claim Japan actually performed significantly better than the United States and other nations during the so-called “lost decades”.
Japanese Inflation
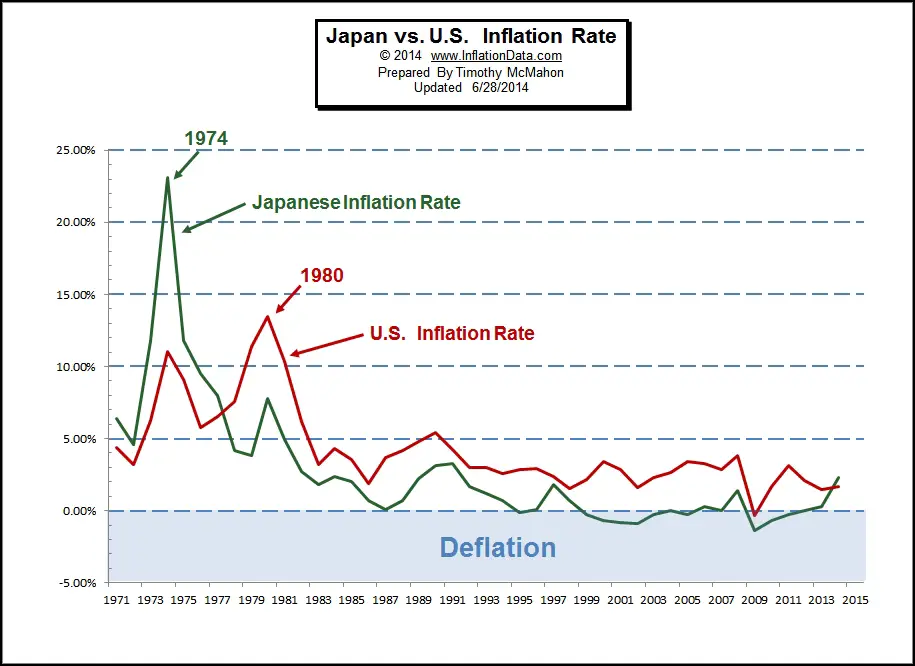
During the 1970’s inflation in Japan spiked to an annual average of over 23% in 1974 up from 6.42% in 1971. Inflation in the U.S. was also spiking at that time but “only” averaged 11.04% in 1974 and 4.38% in 1971. By 1979 however, U.S. inflation was averaging 13.37% but Japanese inflation had fallen to 3.77%. 1980 saw the final spike in Japanese inflation to 7.82% for the year (while U.S. inflation averaged 13.5%) and from there Japanese inflation fell steadily until it was virtually non-existent at 0.11% in 1987.
Japanese inflation ticked upward over the next four years and by 1991 it had reached an annual average of 3.28% but over the following four years it declined so by 1995, registered a deflationary -0.10%. For the next 18 years from 1995-2013 Japan battled deflation with only 1997 and 2008 having inflation above 1%.
Average Annual Inflation US vs. Japan
 Click for Larger Image
The Japanese average annual inflation rate peaked in 1974 at 23.1% with the 12 month period ending in February 1974 actually reaching 25% inflation. Average annual U.S. inflation peaked six years later in 1980 at “only” 13.5% but the individual 12 month period ending in March 1980 had a peak of 14.76%. Japanese inflation crossed below U.S. inflation in 1978 and has remained below until 2014.
| Year | Japan | U.S. |
| 1971 | 6.40% | 4.38% |
| 1972 | 4.60% | 3.21% |
| 1973 | 11.80% | 6.22% |
| 1974 | 23.10% | 11.04% |
| 1975 | 11.80% | 9.13% |
| 1976 | 9.50% | 5.76% |
| 1977 | 8.00% | 6.50% |
| 1978 (crossover) | 4.20% | 7.59% |
| 1979 | 3.80% | 11.35% |
| 1980 | 7.80% | 13.50% |
| 1981 | 4.90% | 10.32% |
| 1982 | 2.70% | 6.16% |
| 1983 | 1.80% | 3.21% |
| 1984 | 2.40% | 4.32% |
| 1985 | 2.00% | 3.56% |
| 1986 | 0.70% | 1.86% |
| 1987 | 0.10% | 3.65% |
| 1988 | 0.70% | 4.14% |
| 1989 | 2.20% | 4.82% |
| 1990 | 3.10% | 5.40% |
| 1991 | 3.30% | 4.21% |
| 1992 | 1.70% | 3.01% |
| 1993 | 1.20% | 2.99% |
| 1994 | 0.70% | 2.56% |
| 1995 | -0.10% | 2.83% |
| 1996 | 0.10% | 2.92% |
| 1997 | 1.80% | 2.34% |
| 1998 | 0.70% | 1.55% |
| 1999 | -0.30% | 2.19% |
| 2000 | -0.70% | 3.38% |
| 2001 | -0.80% | 2.83% |
| 2002 | -0.90% | 1.59% |
| 2003 | -0.30% | 2.27% |
| 2004 | 0.00% | 2.68% |
| 2005 | -0.30% | 3.39% |
| 2006 | 0.30% | 3.24% |
| 2007 | 0.00% | 2.85% |
| 2008 | 1.40% | 3.85% |
| 2009 | -1.40% | -0.34% |
| 2010 | -0.70% | 1.64% |
| 2011 | -0.30% | 3.16% |
| 2012 | 0.00% | 2.07% |
| 2013 | 0.30% | 1.47% |
| 2014 Crossover | 2.32% | 1.66% |
| (Partial Year) |
Abenomics and the Return to Inflation
After resigning in September 2007 for health reasons, on September 26, 2012 Prime Minister Shinzo Abe staged a political comeback. After more than 20 years of stable to falling prices and a stagnant economy, the Japanese people are tired of deflation and Abe is credited with the improvement in the Japanese economy through an inflationary policy combining increased government spending with unprecedented monetary easing. This approach has been labeled “Abenomics” and so far has resulted in inflation rates spiking up to over 3% in 2014.
In the short run, the people of Japan may appreciate the looser money conditions, but if inflation returns to 1970 levels they will long for a return to the good old stable pricing days of the “lost decades”. Inflation stimulates purchases at the expense of future savings and stability. Although money can be created out of thin air, wealth can not.
Historical Japanese Inflation Rates 1971-2014
| Year | Jan | Feb | Mar | Apr | May | Jun | Jul | Aug | Sep | Oct | Nov | Dec | Ave |
| 2014 | 1.4% | 1.5% | 1.6% | 3.4% | 3.7% | 2.3% | |||||||
| 2013 | -0.3% | -0.6% | -0.9% | -0.7% | -0.3% | 0.2% | 0.7% | 0.9% | 1.0% | 1.1% | 1.5% | 1.6% | 0.3% |
| 2012 | 0.1% | 0.3% | 0.5% | 0.5% | 0.2% | -0.1% | -0.4% | -0.5% | -0.3% | -0.4% | -0.2% | -0.1% | 0.0% |
| 2011 | -0.6% | -0.5% | -0.5% | -0.5% | -0.4% | -0.4% | 0.2% | 0.2% | 0.0% | -0.2% | -0.5% | -0.2% | -0.3% |
| 2010 | -1.0% | -0.8% | -0.8% | -0.8% | -0.7% | -0.7% | -1.0% | -1.1% | -0.9% | -0.2% | -0.3% | -0.4% | -0.7% |
| 2009 | 0.0% | -0.1% | -0.3% | -0.1% | -1.1% | -1.8% | -2.2% | -2.2% | -2.2% | -2.5% | -1.9% | -1.7% | -1.4% |
| 2008 | 0.7% | 1.0% | 1.2% | 0.8% | 1.3% | 2.0% | 2.3% | 2.1% | 2.1% | 1.7% | 1.0% | 0.4% | 1.4% |
| 2007 | 0.0% | -0.2% | -0.1% | 0.0% | 0.0% | -0.2% | 0.0% | -0.2% | -0.2% | 0.3% | 0.6% | 0.7% | 0.0% |
| 2006 | -0.1% | -0.1% | -0.2% | -0.1% | 0.1% | 0.5% | 0.3% | 0.9% | 0.6% | 0.4% | 0.3% | 0.3% | 0.3% |
| 2005 | 0.2% | -0.1% | 0.0% | 0.1% | 0.1% | -0.5% | -0.3% | -0.3% | -0.3% | -0.8% | -1.0% | -0.4% | -0.3% |
| 2004 | -0.3% | 0.0% | -0.1% | -0.4% | -0.5% | 0.0% | -0.1% | -0.2% | 0.0% | 0.5% | 0.8% | 0.2% | 0.0% |
| 2003 | -0.4% | -0.2% | -0.1% | -0.1% | -0.2% | -0.4% | -0.2% | -0.3% | -0.2% | 0.0% | -0.5% | -0.4% | -0.3% |
| 2002 | -1.5% | -1.6% | -1.2% | -1.1% | -0.9% | -0.7% | -0.8% | -0.9% | -0.7% | -0.9% | -0.4% | -0.3% | -0.9% |
| 2001 | -0.3% | -0.4% | -0.8% | -0.8% | -0.8% | -0.9% | -0.9% | -0.8% | -0.9% | -0.9% | -1.1% | -1.3% | -0.8% |
| 2000 | -0.7% | -0.6% | -0.5% | -0.0% | -0.7% | -0.6% | -0.5% | -0.5% | -0.9% | -1.1% | -0.8% | -0.4% | -0.7% |
| 1999 | 0.2% | -0.1% | -0.4% | -0.0% | -0.4% | -0.3% | -0.1% | 0.3% | -0.2% | -0.7% | -1.1% | -1.1% | -0.3% |
| 1998 | 1.9% | 2.0% | 2.3% | 0.4% | 0.5% | 0.1% | -0.1% | -0.3% | -0.2% | 0.2% | 0.8% | 0.6% | 0.7% |
| 1997 | 0.6% | 0.6% | 0.5% | 2.0% | 2.0% | 2.3% | 2.0% | 2.2% | 2.5% | 2.6% | 2.2% | 1.9% | 1.8% |
| 1996 | -0.5% | -0.4% | -0.1% | 0.2% | 0.2% | 0.0% | 0.4% | 0.2% | 0.0% | 0.5% | 0.5% | 0.6% | 0.1% |
| 1995 | 0.5% | 0.2% | -0.3% | -0.2% | -0.1% | 0.2% | 0.1% | -0.2% | 0.1% | -0.7% | -0.7% | -0.4% | -0.1% |
| 1994 | 1.3% | 1.2% | 1.3% | 0.8% | 0.8% | 0.5% | -0.2% | 0.0% | 0.2% | 0.8% | 1.0% | 0.6% | 0.7% |
| 1993 | 1.2% | 1.4% | 1.2% | 0.9% | 0.9% | 0.9% | 1.9% | 1.8% | 1.5% | 1.3% | 1.0% | 1.1% | 1.2% |
| 1992 | 1.8% | 2.0% | 2.0% | 2.4% | 2.0% | 2.3% | 1.6% | 1.7% | 2.0% | 1.0% | 0.6% | 1.1% | 1.7% |
| 1991 | 4.0% | 3.5% | 3.6% | 3.5% | 3.4% | 3.5% | 3.5% | 3.4% | 2.6% | 2.7% | 3.1% | 2.7% | 3.3% |
| 1990 | 3.3% | 3.7% | 3.7% | 2.6% | 2.6% | 2.3% | 2.3% | 2.7% | 2.7% | 3.0% | 3.9% | 3.7% | 3.1% |
| 1989 | 1.0% | 1.0% | 1.1% | 2.3% | 2.8% | 2.9% | 3.0% | 2.6% | 2.7% | 3.0% | 2.2% | 2.7% | 2.2% |
| 1988 | 0.9% | 0.7% | 0.7% | 0.3% | 0.2% | 0.2% | 0.4% | 0.7% | 0.6% | 1.0% | 1.2% | 1.0% | 0.7% |
| 1987 | -1.0% | -0.9% | -0.6% | 0.1% | 0.0% | 0.3% | 0.1% | 0.5% | 0.9% | 0.8% | 0.7% | 0.8% | 0.1% |
| 1986 | 1.5% | 1.7% | 1.4% | 1.0% | 1.1% | 0.6% | 0.1% | 0.1% | 0.5% | -0.3% | 0.0% | -0.3% | 0.7% |
| 1985 | 2.7% | 1.7% | 1.9% | 2.2% | 1.7% | 2.4% | 2.4% | 3.0% | 1.6% | 1.8% | 1.5% | 1.5% | 2.0% |
| 1984 | 1.9% | 2.9% | 2.5% | 2.4% | 2.0% | 1.9% | 2.6% | 1.9% | 2.3% | 2.2% | 2.2% | 2.7% | 2.4% |
| 1983 | 2.2% | 1.8% | 2.4% | 1.9% | 2.6% | 2.0% | 2.2% | 1.3% | 0.9% | 1.4% | 1.9% | 1.7% | 1.8% |
| 1982 | 3.1% | 3.3% | 2.9% | 3.0% | 2.5% | 2.2% | 2.0% | 3.2% | 3.1% | 3.2% | 2.2% | 2.1% | 2.7% |
| 1981 | 7.3% | 6.3% | 6.1% | 5.0% | 5.1% | 4.9% | 4.4% | 4.1% | 4.1% | 4.1% | 3.8% | 4.2% | 4.9% |
| 1980 | 6.6% | 7.8% | 7.4% | 8.0% | 8.0% | 8.2% | 7.5% | 8.3% | 8.7% | 7.6% | 8.4% | 7.2% | 7.8% |
| 1979 | 3.6% | 2.7% | 2.6% | 2.9% | 3.2% | 3.8% | 4.3% | 3.0% | 3.3% | 4.3% | 4.9% | 5.8% | 3.8% |
| 1978 | 4.5% | 4.6% | 4.9% | 4.2% | 3.9% | 3.9% | 4.5% | 4.7% | 4.0% | 3.7% | 3.7% | 3.9% | 4.2% |
| 1977 | 9.5% | 9.1% | 9.6% | 8.9% | 9.3% | 8.7% | 7.6% | 8.5% | 7.7% | 7.6% | 6.5% | 4.9% | 8.0% |
| 1976 | 8.7% | 9.4% | 8.6% | 9.4% | 9.3% | 9.5% | 9.8% | 9.5% | 9.8% | 8.8% | 9.2% | 10.6% | 9.5% |
| 1975 | 17.4% | 13.9% | 14.5% | 13.3% | 13.4% | 13.0% | 11.1% | 9.6% | 10.5% | 9.7% | 8.5% | 8.1% | 11.8% |
| 1974 | 22.0% | 25.0% | 22.6% | 23.7% | 22.1% | 22.3% | 23.8% | 24.1% | 22.3% | 24.5% | 24.6% | 21.1% | 23.1% |
| 1973 | 6.5% | 7.0% | 8.7% | 9.1% | 11.0% | 11.0% | 11.8% | 11.7% | 14.4% | 14.3% | 15.1% | 18.2% | 11.8% |
| 1972 | 4.1% | 4.4% | 5.3% | 5.2% | 4.9% | 4.6% | 4.9% | 5.8% | 3.9% | 4.2% | 5.1% | 5.7% | 4.6% |
| 1971 | 6.6% | 6.3% | 5.3% | 5.8% | 6.5% | 7.1% | 6.8% | 7.1% | 7.9% | 6.6% | 5.7% | 4.7% | 6.4% |
Japanese Consumer Price Index
By looking at the Consumer Price index for Japan we can see how stable prices really were… for instance in August of 1993 the index first crossed above 101 and the index number 101 reappears repeatedly up until as recently as March of 2014. So for over 20 years prices were virtually the same.
On the other hand the CPI index in the United States was 144.8 and in March of 2014 it was 236.293. So if we use our cumulative inflation calculator we get 63.19% inflation. That means that in order to just maintain the same standard of living Americans would have to get a 63.19% raise over that period while the Japanese would be way ahead of us by simply getting a 1% annual raise. And for those in the U.S., who are retired and living off of investments, unless your investments grew by 63% you would actually be tapping into the principle (and paying taxes on the imaginary “gain”) for the privilege to do it, while if retired Japanese had made 63% they would be way ahead.
| Year | Jan | Feb | Mar | Apr | May | Jun | Jul | Aug | Sep | Oct | Nov | Dec | Ave |
| 2014 | 100.7 | 100.7 | 101 | 103.1 | 103.5 | ||||||||
| 2013 | 99.3 | 99.2 | 99.4 | 99.7 | 99.8 | 99.8 | 100 | 100.3 | 100.6 | 100.7 | 100.7 | 100.9 | 100 |
| 2012 | 99.6 | 99.8 | 100.3 | 100.4 | 100.1 | 99.6 | 99.3 | 99.4 | 99.6 | 99.6 | 99.2 | 99.3 | 99.7 |
| 2011 | 99.5 | 99.5 | 99.8 | 99.9 | 99.9 | 99.7 | 99.7 | 99.9 | 99.9 | 100 | 99.4 | 99.4 | 99.7 |
| 2010 | 100.1 | 100 | 100.3 | 100.4 | 100.3 | 100.1 | 99.5 | 99.7 | 99.9 | 100.2 | 99.9 | 99.6 | 100 |
| 2009 | 101.1 | 100.8 | 101.1 | 101.2 | 101 | 100.8 | 100.5 | 100.8 | 100.8 | 100.4 | 100.2 | 100 | 100.7 |
| 2008 | 101.1 | 100.9 | 101.4 | 101.3 | 102.1 | 102.6 | 102.8 | 103.1 | 103.1 | 103 | 102.1 | 101.7 | 102.1 |
| 2007 | 100.4 | 99.9 | 100.2 | 100.5 | 100.8 | 100.6 | 100.5 | 101 | 101 | 101.3 | 101.1 | 101.3 | 100.7 |
| 2006 | 100.4 | 100.1 | 100.3 | 100.5 | 100.8 | 100.8 | 100.5 | 101.2 | 101.2 | 101.0 | 100.5 | 100.6 | 100.7 |
| 2005 | 100.5 | 100.2 | 100.5 | 100.6 | 100.7 | 100.3 | 100.2 | 100.3 | 100.6 | 100.6 | 100.2 | 100.3 | 100.4 |
| 2004 | 100.3 | 100.3 | 100.5 | 100.5 | 100.6 | 100.8 | 100.5 | 100.6 | 100.9 | 101.4 | 101.2 | 100.7 | 100.7 |
| 2003 | 100.6 | 100.3 | 100.6 | 100.9 | 101.1 | 100.8 | 100.6 | 100.8 | 100.9 | 100.9 | 100.4 | 100.5 | 100.7 |
| 2002 | 101.0 | 100.5 | 100.7 | 101.0 | 101.3 | 101.2 | 100.8 | 101.1 | 101.1 | 100.9 | 100.9 | 100.9 | 101.0 |
| 2001 | 102.5 | 102.1 | 101.9 | 102.1 | 102.2 | 101.9 | 101.6 | 102.0 | 101.8 | 101.8 | 101.3 | 101.2 | 101.9 |
| 2000 | 102.8 | 102.5 | 102.7 | 102.9 | 103.0 | 102.8 | 102.5 | 102.8 | 102.7 | 102.7 | 102.4 | 102.5 | 102.7 |
| 1999 | 103.5 | 103.1 | 103.2 | 103.7 | 103.7 | 103.4 | 103.0 | 103.3 | 103.6 | 103.8 | 103.2 | 102.9 | 103.4 |
| 1998 | 103.3 | 103.2 | 103.6 | 103.8 | 104.1 | 103.7 | 103.1 | 103.0 | 103.8 | 104.5 | 104.4 | 104.0 | 103.7 |
| 1997 | 101.4 | 101.2 | 101.3 | 103.4 | 103.6 | 103.6 | 103.2 | 103.3 | 104.0 | 104.3 | 103.6 | 103.4 | 103.0 |
| 1996 | 100.8 | 100.6 | 100.8 | 101.4 | 101.6 | 101.3 | 101.2 | 101.1 | 101.5 | 101.7 | 101.4 | 101.5 | 101.2 |
| 1995 | 101.3 | 101.0 | 100.9 | 101.2 | 101.4 | 101.3 | 100.8 | 100.9 | 101.5 | 101.2 | 100.9 | 100.9 | 101.1 |
| 1994 | 100.8 | 100.8 | 101.2 | 101.4 | 101.5 | 101.1 | 100.7 | 101.1 | 101.4 | 101.9 | 101.6 | 101.3 | 101.2 |
| 1993 | 99.5 | 99.6 | 99.9 | 100.6 | 100.7 | 100.6 | 100.9 | 101.1 | 101.2 | 101.1 | 100.6 | 100.7 | 100.5 |
| 1992 | 98.3 | 98.2 | 98.7 | 99.7 | 99.8 | 99.7 | 99.0 | 99.3 | 99.7 | 99.8 | 99.6 | 99.6 | 99.3 |
| 1991 | 96.6 | 96.3 | 96.8 | 97.4 | 97.8 | 97.5 | 97.4 | 97.6 | 97.7 | 98.8 | 99.0 | 98.5 | 97.6 |
| 1990 | 92.9 | 93.0 | 93.4 | 94.1 | 94.6 | 94.2 | 94.1 | 94.4 | 95.2 | 96.2 | 96.0 | 95.9 | 94.5 |
| 1989 | 89.9 | 89.7 | 90.1 | 91.7 | 92.2 | 92.1 | 92.0 | 91.9 | 92.7 | 93.4 | 92.4 | 92.5 | 91.7 |
| 1988 | 89.0 | 88.8 | 89.1 | 89.6 | 89.7 | 89.5 | 89.3 | 89.6 | 90.3 | 90.7 | 90.4 | 90.1 | 89.7 |
| 1987 | 88.2 | 88.2 | 88.5 | 89.3 | 89.5 | 89.3 | 88.9 | 89.0 | 89.8 | 89.8 | 89.3 | 89.2 | 89.1 |
| 1986 | 89.1 | 89.0 | 89.0 | 89.2 | 89.5 | 89.0 | 88.8 | 88.6 | 89.0 | 89.1 | 88.7 | 88.5 | 89.0 |
| 1985 | 87.8 | 87.5 | 87.8 | 88.3 | 88.5 | 88.5 | 88.7 | 88.5 | 88.6 | 89.4 | 88.7 | 88.8 | 88.4 |
| 1984 | 85.5 | 86.0 | 86.2 | 86.4 | 87.0 | 86.4 | 86.6 | 85.9 | 87.2 | 87.8 | 87.4 | 87.5 | 86.7 |
| 1983 | 83.9 | 83.6 | 84.1 | 84.4 | 85.3 | 84.8 | 84.4 | 84.3 | 85.2 | 85.9 | 85.5 | 85.2 | 84.7 |
| 1982 | 82.1 | 82.1 | 82.1 | 82.8 | 83.1 | 83.1 | 82.6 | 83.2 | 84.4 | 84.7 | 83.9 | 83.8 | 83.2 |
| 1981 | 79.6 | 79.5 | 79.8 | 80.4 | 81.1 | 81.3 | 81.0 | 80.6 | 81.9 | 82.1 | 82.1 | 82.1 | 81.0 |
| 1980 | 74.2 | 74.8 | 75.2 | 76.6 | 77.2 | 77.5 | 77.6 | 77.4 | 78.7 | 78.9 | 79.1 | 78.8 | 77.2 |
| 1979 | 69.6 | 69.4 | 70.0 | 70.9 | 71.5 | 71.6 | 72.2 | 71.5 | 72.4 | 73.3 | 73.0 | 73.5 | 71.6 |
| 1978 | 67.2 | 67.6 | 68.2 | 68.9 | 69.3 | 69.0 | 69.2 | 69.4 | 70.1 | 70.3 | 69.6 | 69.5 | 69.0 |
| 1977 | 64.3 | 64.6 | 65.0 | 66.1 | 66.7 | 66.4 | 66.2 | 66.3 | 67.4 | 67.8 | 67.1 | 66.9 | 66.2 |
| 1976 | 58.7 | 59.2 | 59.3 | 60.7 | 61.0 | 61.1 | 61.5 | 61.1 | 62.6 | 63.0 | 63.0 | 63.8 | 61.3 |
| 1975 | 54.0 | 54.1 | 54.6 | 55.5 | 55.8 | 55.8 | 56.0 | 55.8 | 57.0 | 57.9 | 57.7 | 57.7 | 56.0 |
| 1974 | 46.0 | 47.5 | 47.7 | 49.0 | 49.2 | 49.4 | 50.4 | 50.9 | 51.6 | 52.8 | 53.2 | 53.4 | 50.1 |
| 1973 | 37.7 | 38.0 | 38.9 | 39.6 | 40.3 | 40.4 | 40.7 | 41.0 | 42.2 | 42.4 | 42.7 | 44.1 | 40.7 |
| 1972 | 35.4 | 35.5 | 35.8 | 36.3 | 36.3 | 36.4 | 36.4 | 36.7 | 36.9 | 37.1 | 37.1 | 37.3 | 36.4 |
| 1971 | 34.0 | 34.0 | 34.0 | 34.5 | 34.6 | 34.8 | 34.7 | 34.7 | 35.5 | 35.6 | 35.3 | 35.3 | 34.8 |
| 1970 | 31.9 | 32.0 | 32.3 | 32.6 | 32.5 | 32.5 | 32.5 | 32.4 | 32.9 | 33.4 | 33.4 | 33.7 | 32.7 |
Source: Japanese Inflation and CPI- St Louis Federal Reserve
Leave a Reply