The Cost of Living affects everyone and always seems to be increasing causing families to struggle financially.
- Cost of Living Articles
- Cost of Gas
- Cost of Gas Per Month Calculator
- Average Cost of Gas Per Month
- Inflation Adjusted Gas Prices
- Food Prices 1913-2013
- Health Insurance
- Calculate Cost of Living
- Cost of Living Allowance (COLA)
- Cost of Living Adjustment
- Cost of Living
- Inflation Rate
- Inflation
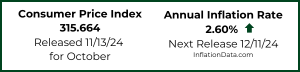
- Consumer Price Index

Leave a Reply