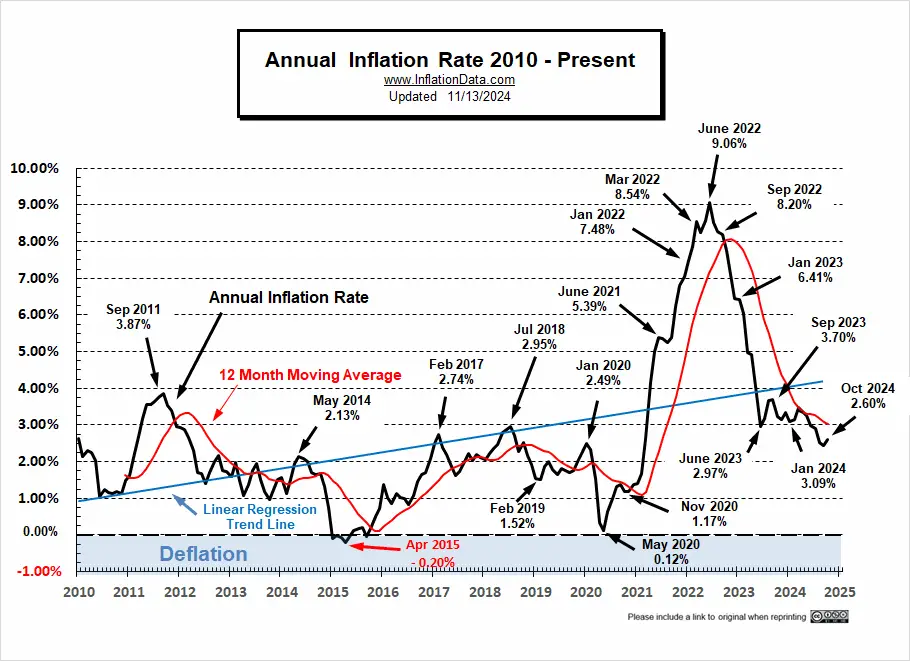
The U.S. Bureau of Labor Statistics released its October Inflation report on Wednesday November 13th showing Annual Inflation was up from 2.4% in September to 2.6% in October.
(But since we calculate it to two digits, it was actually 2.44% in September and 2.60% in October.) On a non-seasonally adjusted basis, monthly inflation in September was 0.16% and fell to 0.12% in October but annual inflation rose because October 2023 was negative at -0.04%.
Gold Prices:
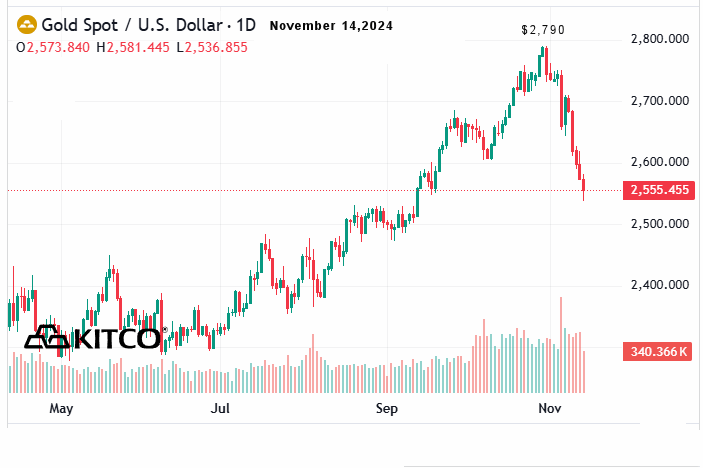
As I’ve been saying for a long time, gold is more of an uncertainty (or crisis) hedge than an inflation hedge. And apparently, the U.S. Election settled a lot of uncertainty. Spot gold peaked at $2,790 at the end of October and fell sharply after the election, down 8.3% as of this writing. The market appears to be betting that Trump can end the war in Ukraine and improve the U.S. economy as well.
“Risk-Off” assets like gold have fallen while all “Risk-On” assets including Large and Small Cap Stocks, and BitCoin have skyrocketed.
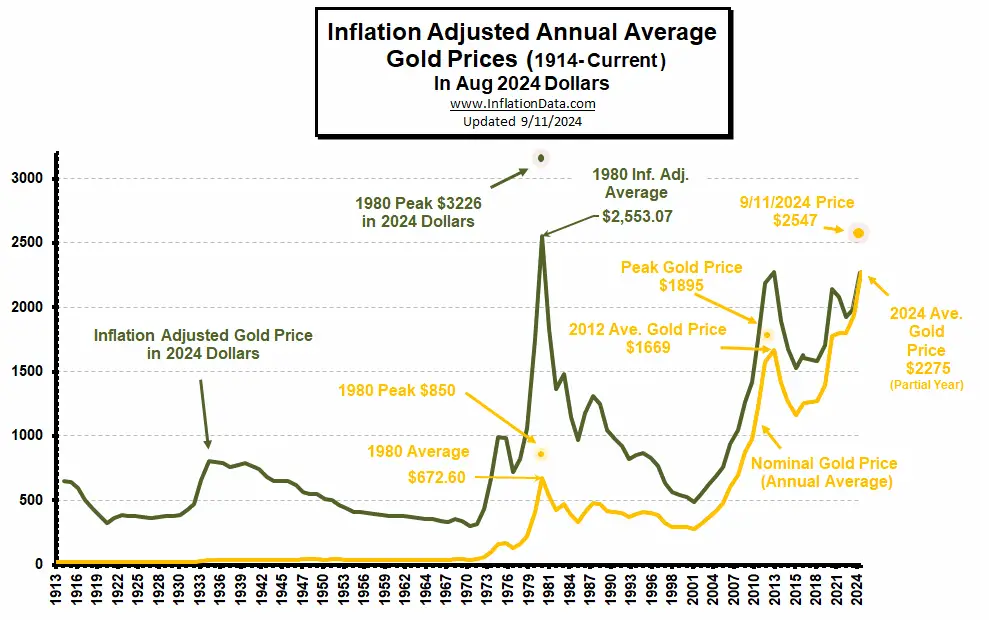
Back in September, we published the following inflation-adjusted gold chart suggesting that gold was nearing historical highs, not only in nominal terms, but also in inflation-adjusted terms.
Inflation Prediction:
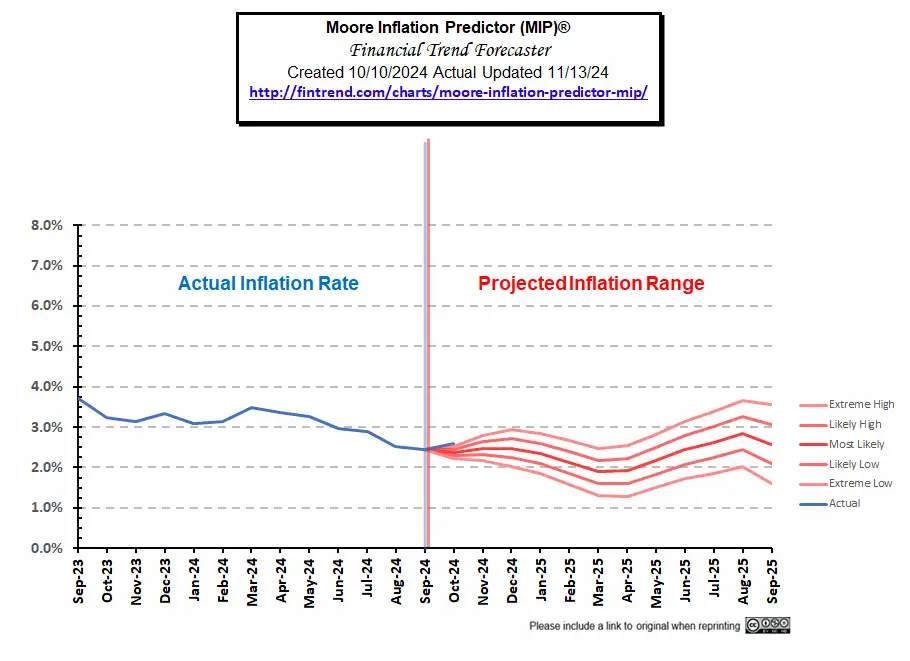
Inflation for October came in slightly above our high prediction. We warned that with a negative number falling out of the calculation inflation could be up. And the same is true for the next two months.
See this month’s MIP prediction
October 2024 Inflation Summary:
- Annual Inflation rose from 2.44% to 2.60%
- CPI Index rose from 315.301 to 315.664
- Monthly Inflation for October 2024 was 0.12% up from –0.04% in October 2023.
- Next release Dec 11th 2024
| Jan | Feb | Mar | Apr | May | June | July | Aug | Sep | Oct | Nov | Dec | |
| 2022 | 7.48% | 7.87% | 8.54% | 8.26% | 8.58% | 9.06% | 8.52% | 8.26% | 8.20% | 7.75% | 7.11% | 6.45% |
| 2023 | 6.41% | 6.04% | 4.98% | 4.93% | 4.05% | 2.97% | 3.18% | 3.67% | 3.70% | 3.24% | 3.14% | 3.35% |
| 2024 | 3.09% | 3.15% | 3.48% | 3.36% | 3.27% | 2.97% | 2.89% | 2.53% | 2.44% | 2.60% |
BLS Commentary:
The BLS Commissioner reported:
“The Consumer Price Index for All Urban Consumers (CPI-U) increased 0.2 percent on a seasonally adjusted basis in October, the same increase as in each of the previous 3 months, the U.S. Bureau of Labor Statistics reported today.
Over the last 12 months, the all items index increased 2.6 percent before seasonal adjustment. The index for shelter rose 0.4 percent in October, accounting for over half of the monthly all items increase. The food index also increased over the month, rising 0.2 percent as the food at home index increased 0.1 percent and the food away from home index rose 0.2 percent. The energy index was unchanged over the month, after declining 1.9 percent in September.”
Looking at table A below we can see that on an annual basis energy and commodities are pulling inflation down and both Energy Services and Other Services are pulling it up.
The biggest gainers on an annual basis were Food away from home, shelter, transportation, and Medical services
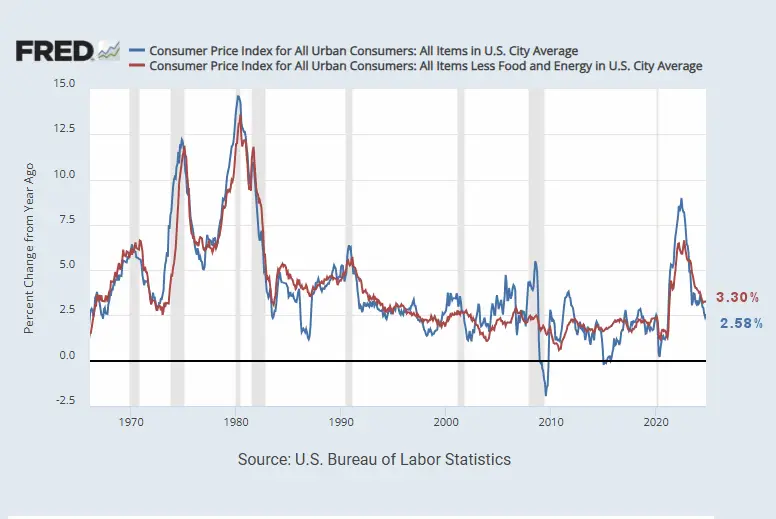
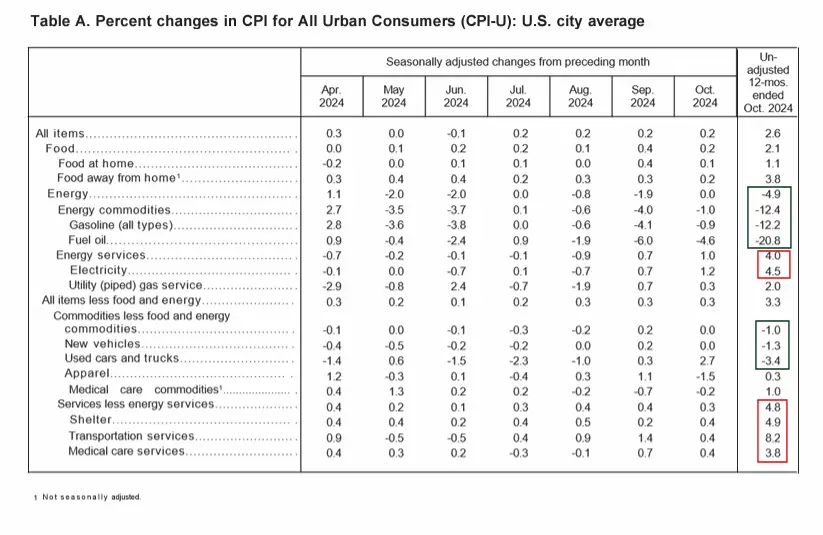 Although these “Seasonally Adjusted” numbers are slightly different than those presented by the BLS, the following chart from the Federal Reserve shows the gap between inflation with and without Food and Energy. Comparing the two we can see how much food and energy contribute toward overall inflation.
If the blue line is above the red line, food and energy, add to the overall inflation rate. But if blue is below the red line, they are actually mitigating overall inflation. With Energy prices on a monthly basis still negative they are still moderating overall inflation.
Source: St. Louis FED
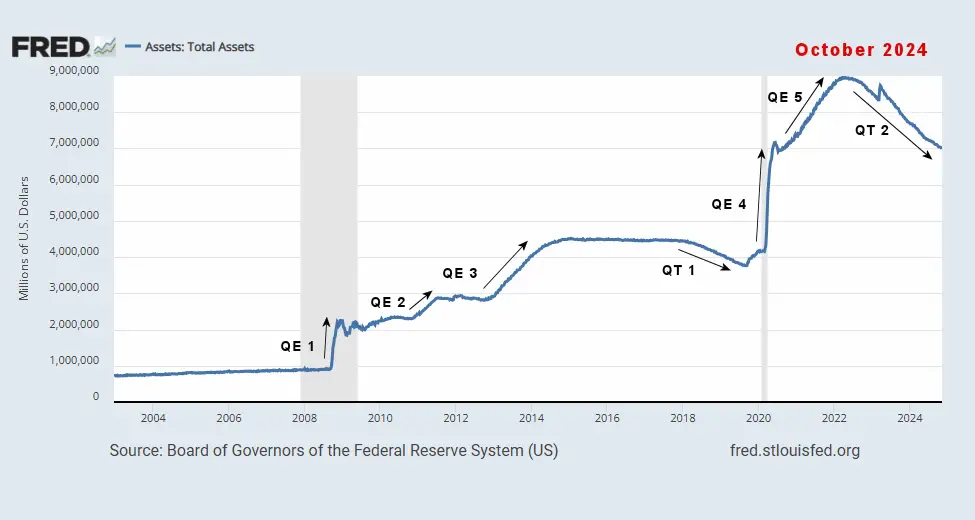
FED Assets
FED assets continue downward.
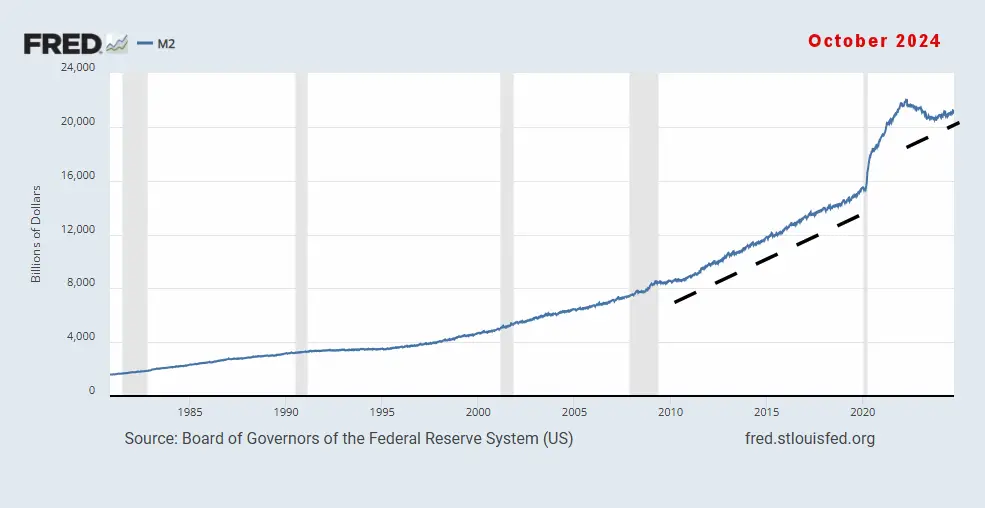
M2 Money Supply
But M2 money supply is trending upward at pretty much the same rate as prior to COVID.
More info about FED Monetary Policy and Inflation
Inflation Chart
Monthly Inflation Compared to Previous Years:
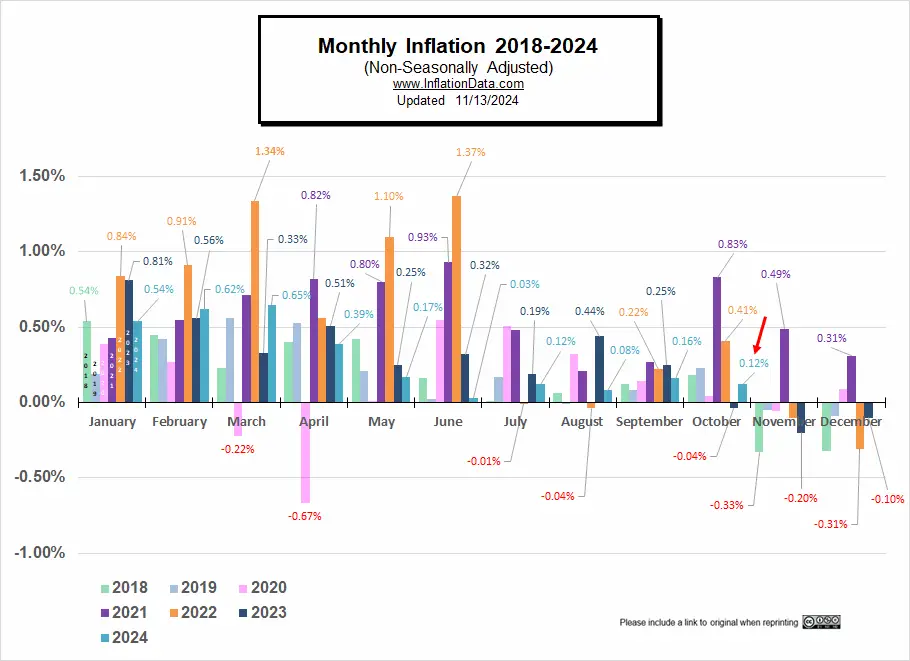
The monthly inflation rate for October 2024 was 0.12%.
In the chart below, we can see how the UNADJUSTED monthly inflation compares between 2018 (light green), 2019 (light blue), 2020 (pink), 2021 (purple), 2022 (orange), 2023 (dark), 2024 (teal). Interestingly, January 2018 and January 2024 are identical. In 2024 monthly inflation started a bit higher than average at 0.54%, 0.62%, 0.65%, but April, May, and June 2024 came in significantly lower than 2023, which brought annual inflation down. September 2024 was 0.16% compared to 0.25% in September 2023.
Not Seasonally Adjusted Monthly Inflation Rates
Note: January 2022’s 0.84% was the highest January since 1990. June was the highest June since 1941 (although the first quarter of 1980 had some higher rates). Typically, the first quarter has the highest monthly inflation and the 4th quarter is the lowest (even negative).
| Jan | Feb | Mar | Apr | May | Jun | Jul | Aug | Sep | Oct | Nov | Dec | |
| 2016 | 0.17% | 0.08% | 0.43% | 0.47% | 0.41% | 0.33% | (0.16%) | 0.09% | 0.24% | 0.12% | (0.16%) | 0.03% |
| 2017 | 0.58% | 0.31% | 0.08% | 0.30% | 0.09% | 0.09% | (0.07%) | 0.30% | 0.53% | (0.06%) | 0.002% | (0.06%) |
| 2018 | 0.54% | 0.45% | 0.23% | 0.40% | 0.42% | 0.16% | 0.01% | 0.06% | 0.12% | 0.18% | (0.33%) | (0.32%) |
| 2019 | 0.19% | 0.42% | 0.56% | 0.53% | 0.21% | 0.02% | 0.17% | (0.01%) | 0.08% | 0.23% | (0.05%) | (0.09%) |
| 2020 | 0.39% | 0.27% | (0.22%) | (0.67%) | 0.002% | 0.55% | 0.51% | 0.32% | 0.14% | 0.04% | (0.06%) | 0.09% |
| 2021 | 0.43% | 0.55% | 0.71% | 0.82% | 0.80% | 0.93% | 0.48% | 0.21% | 0.27% | 0.83% | 0.49% | 0.31% |
| 2022 | 0.84% | 0.91% | 1.34% | 0.56% | 1.10% | 1.37% | (0.01%) | (0.04%) | 0.22% | 0.41% | (0.10%) | (0.34%) |
| 2023 | 0.80% | 0.56% | 0.33% | 0.51% | 0.25% | 0.32% | 0.19% | 0.44% | 0.25% | (0.04%) | (0.20%) | (0.10%) |
| 2024 | 0.54% | 0.62% | 0.65% | 0.39% | 0.17% | 0.03% | 0.12% | 0.08% | 0.16% | 0.12% |
See: Monthly Inflation Rate for more information and a complete table of Unadjusted Monthly Rates.
Misery Index
Current Misery Index:
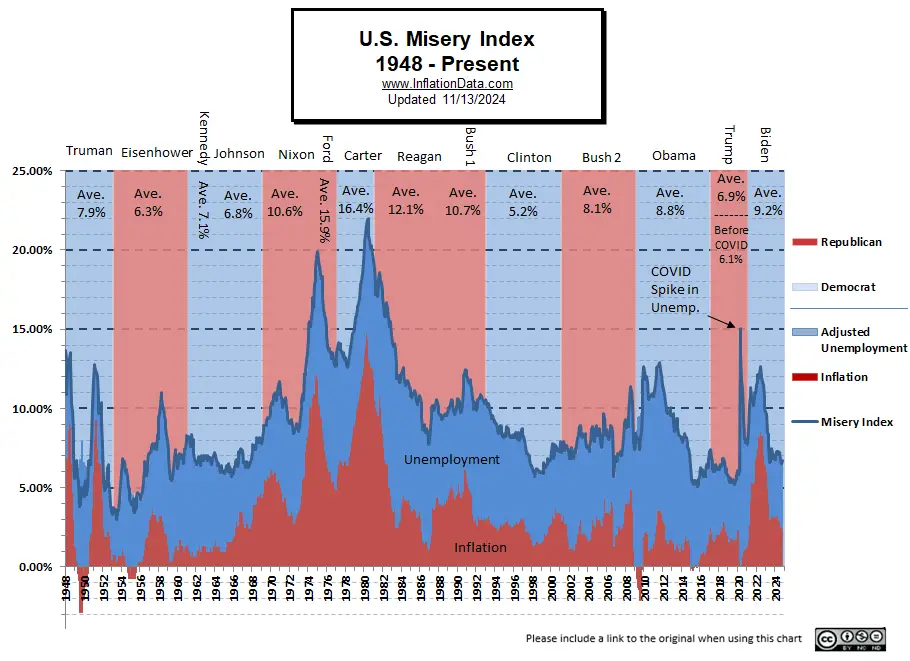
Unemployment 4.10% + Inflation 2.60% = 6.70%
Unemployment and inflation were down so the misery index fell. The Average Misery index under Trump was 6.9% including COVID or 6.1% excluding COVID and so far under Biden the average Misery index is 9.2%.
[Read More on the Misery Index…]
Rate of Change (ROC) Charts
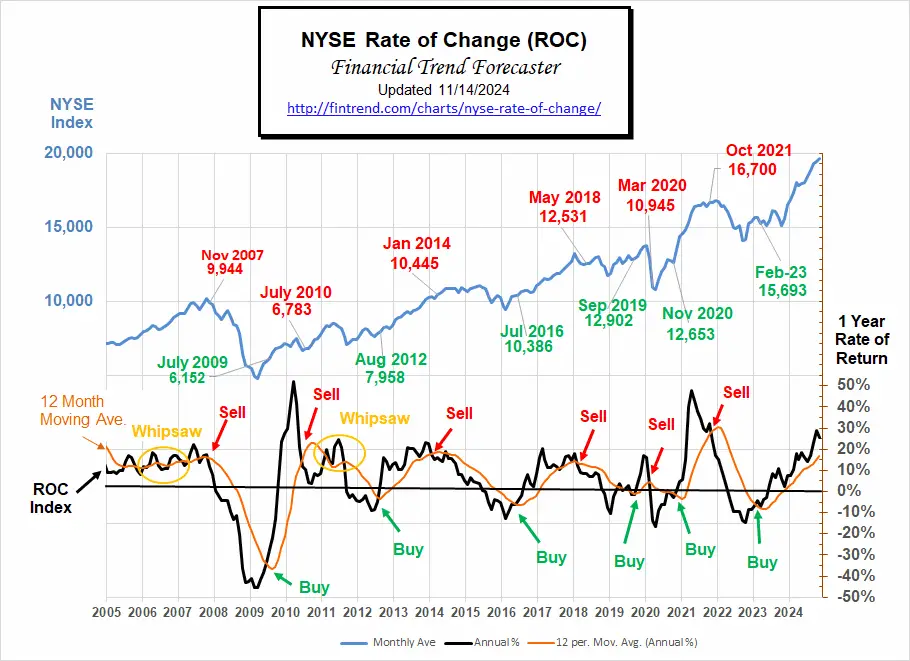
The NYSE ROC chart as of today remains well into buy territory.
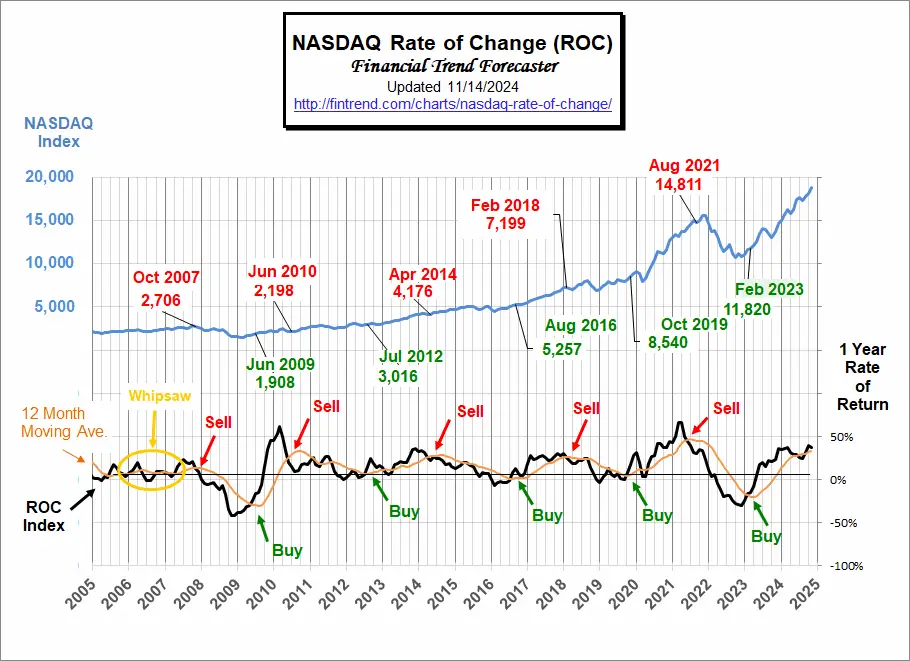
The NASDAQ ROC issued a tentative Sell signal but it has been cancelled with the FED rate cuts.
Bitcoin has shown a massive breakout of its downward channel that was in place since March. After six failed tests of the upper limit the 7th succeeded and in perfect fashion went back to test the channel before rocketing higher. See Bitcoin Breaks out for more…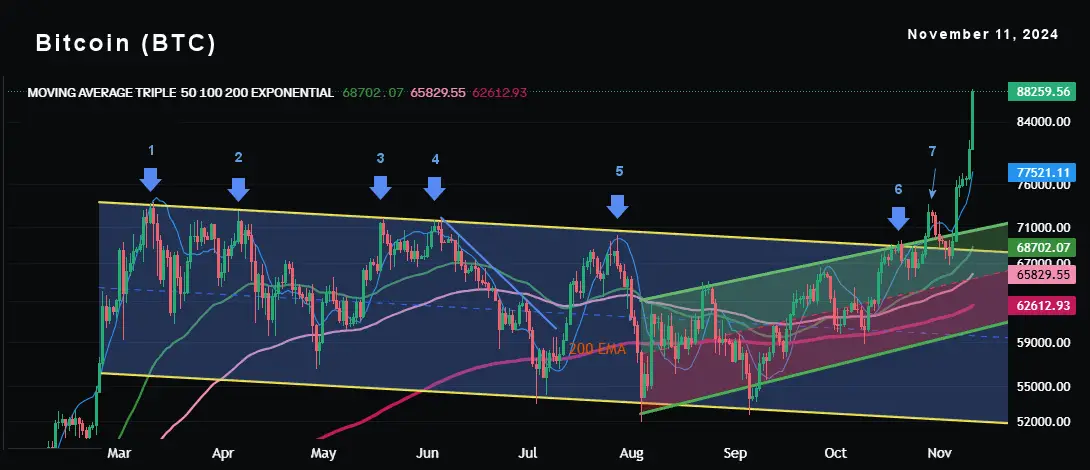
For more information, see NYSE Rate of Change (ROC) , NASDAQ ROC Chart, and Crypto ROC .
You Might Also Like:
From InflationData.com
- Inflation-Proofing Your Family Budget
- FED Interest Rates
- Gold Rallies on LOWER August Inflation?
- Optimize Your Finances as Inflation Cools
- What Causes Stagflation?
- Inflation Causes Inequality
From Financial Trend Forecaster
- Moore Inflation Predictor
- NYSE ROC
- NASDAQ ROC
- Crypto ROC
- Bitcoin Breaks Out
- Is Trump Right About Tariffs?
- What Makes MicroStrategy Special
- China’s Monetary Bazooka
- How Much is the Money Supply Growing?
- Is Gold Overpriced?
- Are Some Forms of Taxation Worse Than Others for the Economy?
- Are Price Controls a Good Idea?
- Modern Monetary Theory (MMT)
- Canada’s Economic Crisis
From UnemploymentData.com.
- October 2024 Employment / Unemployment Report
- Can We Trust the September Unemployment Numbers?
- September Jobs Report
- Have Wages Kept Up With Inflation?
From Elliott Wave University
- Invest Like Warren Buffet
- Gold Prices: The calm before a record run
- This Trend Will Likely Soon Rock the U.S. Financial System
- Elliott Wave Analysis of Bitcoin
- Is a China-Taiwan Conflict Likely? Watch the Region’s Stock Market Indexes
From OptioMoney
- Tips for Mastering the Art of Bargaining and Negotiation After Moving to a New Country
- Consumer Culture Contrasting Spending Habits in the US and Europe
- Financial Considerations When Moving to Florida
- Splitting Your Golden Years:
- Home-Buying Guide for Newlyweds
From Your Family Finances
- Maintaining Value in a High-Inflation World
- What Homeowners Need to Know about Florida’s Property Insurance Crisis
- How to Get Money Interest Free
- How to Financially Prepare for Hurricane Season
- Key Considerations for Smooth Wealth Transfer Planning


Leave a Reply