 Lebanon’s economy is crashing and burning… literally. Fiery protests began in August 2019, in the wake of youth unemployment reaching 37% and the general unemployment at 25%. This was even before the entire world shut down due to COVID. And this was just the beginning of hyperinflation for Lebanon. In 2019 Lebanon’s inflation rate averaged a reasonable 2.9% for the entire year, but by July 2020 Lebanese inflation was well into hyperinflationary territory at 112.39%. So prices were moving up so fast they had more than doubled from July 2019 through July 2020. And from there it got worse. From August 2019 through August 2020 prices were up over 120%. And remember that the average for 2019 was only 2.9% so all that inflation happened during 2020. By December 2020 inflation was roaring ahead at over 145%. And by February 2021 it was at 155%.
| Date | Lebanese Annual Inflation Rate |
| Jul-20 | 112.388% |
| Aug-20 | 120.032% |
| Sep-20 | 131.049% |
| Oct-20 | 136.801% |
| Nov-20 | 133.470% |
| Dec-20 | 145.845% |
| Jan-21 | 147.600% |
| Feb-21 | 155.400% |
| Mar-21 | 121.660% |
| Apr-21 | 119.800% |
| May-21 | 100.640% |
Since then Lebanese inflation has subsided somewhat to “only” 100% in May. So prices in May 2021 are still twice what they were in May 2020.
Previous Lebanese Hyperinflation
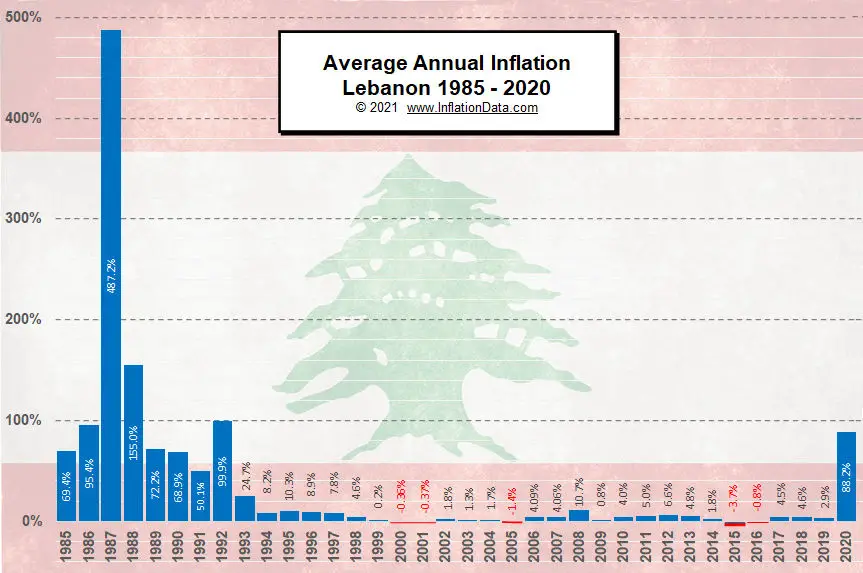
This isn’t the first time in living memory that Lebanon experienced hyperinflation. During the late 1980s and early 1990s, Lebanon suffered possibly worse hyperinflation with a peak of 487% inflation in 1987. Inflation tapered off by 1997 to 7.8%.
In Surviving a Hyperinflation we noted that “Hyperinflation only occurs in countries where the government has already broken down…” and that is certainly the case in Lebanon. The Wikipedia article, 17 October Revolution, talks about the protests beginning in 2019 and continuing through 2021 but the dysfunctional government began way back in 1989 and the only reason that they didn’t see more hyperinflation until now was that the government of Lebanon had pegged their currency to the U.S. dollar in 1997, which effectively curbed inflation for the next 20 years.
In the Spring of 2021, the World Bank released a report regarding the Lebanese economic disaster. It claims that:
“The Lebanon financial and economic crisis is likely to rank in the top 10, possibly top three, most severe crises episodes globally since the mid-nineteenth century… Lebanon’s GDP plummeted from close to US$ 55 billion in 2018 to an estimated US$ 33 billion in 2020, with US$ GDP/capita falling by around 40 percent. Such a brutal and rapid contraction is usually associated with conflicts or wars.”
Two primary contributors to this economic disaster were COVID-19 and the 2020 Port of Beirut explosion. The explosion has been traced to faulty storage of ammonium nitrate fertilizer and it resulted in at least 218 deaths, 7,500 injuries, and $15 billion (US) in property damage, and an estimated 300,000 people left homeless. The blast was so powerful that it was felt across Turkey, Syria, Israel, Palestine, parts of Europe, and was heard in Cyprus, more than 150 miles away. It was even detected by the United States Geological Survey as a seismic event of magnitude 3.3 and is considered one of the most powerful artificial non-nuclear explosions in history. The people of Lebanon blamed the blast on poor regulation by the government, resulting in additional rioting on top of what has been ongoing since 2019.
In addition to the upheaval due to COVID and the explosion, the currency in circulation increased by 197% even as the broad money supply (which includes bank deposits) declined, with the latter weighed down by deleveraging in the financial sector. Real GDP growth contracted by 6.7 percent in 2019 and a further 20.3 percent in 2020. This has resulted in more than half the population living below the national poverty line. In typical hyperinflation fashion, fights have broken out in supermarkets as people try to buy bread, sugar, oil, and other scarce commodities, and the murder rate and other crimes are also rapidly rising.
| Year | Annual Inflation Rate |
| 1985 | 69.4% |
| 1986 | 95.4% |
| 1987 | 487.2% |
| 1988 | 155.0% |
| 1989 | 72.2% |
| 1990 | 68.9% |
| 1991 | 50.1% |
| 1992 | 99.9% |
| 1993 | 24.7% |
| 1994 | 8.2% |
| 1995 | 10.3% |
| 1996 | 8.9% |
| 1997 | 7.8% |
| 1998 | 4.6% |
| 1999 | 0.2% |
| 2000 | -0.36% |
| 2001 | -0.37% |
| 2002 | 1.8% |
| 2003 | 1.3% |
| 2004 | 1.7% |
| 2005 | -1.4% |
| 2006 | 4.09% |
| 2007 | 4.06% |
| 2008 | 10.7% |
| 2009 | 0.8% |
| 2010 | 4.0% |
| 2011 | 5.0% |
| 2012 | 6.6% |
| 2013 | 4.8% |
| 2014 | 1.8% |
| 2015 | -3.7% |
| 2016 | -0.8% |
| 2017 | 4.5% |
| 2018 | 4.6% |
| 2019 | 2.9% |
| 2020 | 88.2% |
Other Hyperinflation Articles:
- What is Hyperinflation?
- How Does Gold Fare During Hyperinflation?
- Confederate Hyperinflation Rates
- Zimbabwean Hyperinflation
- Surviving a Hyperinflation
- Hyperinflation of Weimar Germany
- What is the Velocity of Money?
- How paper money fails


Leave a Reply