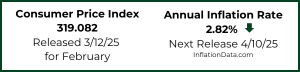
The U.S. Bureau of Labor Statistics released the Annual Inflation Rate data for the year through the end of February on March 13th 2018.
- Annual inflation was 2.21% in February up from 2.07% in January and 2.11% in December
- CPI-U was 248.991 in February from 247.867 in January.
- Monthly Inflation was 0.45% for February and 0.54% in January.
- Next release April 11th
Monthly Inflation is Typically High in the First Quarter
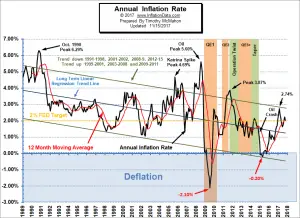 Typically the monthly inflation rate is highest during the first quarter (January through March) and lowest during the last quarter (October through December). February 2018 had inflation of 0.45% which was above February 2017’s 0.31% so we saw an increase in the annual inflation rate (resulting in annual inflation of 2.21%).
However if we had 11 more months of 0.45% inflation we would have 5.4% annual inflation. But when it is combined with lower inflation months and even some negative months the annual inflation is much lower.
See Annual Inflation Chart for more info.
According to the U.S. Bureau of Labor Statistics (BLS) commissioner’s report- “The Consumer Price Index for All Urban Consumers (CPI-U) increased 0.2 percent in February on a seasonally adjusted basis after rising 0.5 percent in January, the U.S. Bureau of Labor Statistics reported today. Over the last 12 months, the all items index rose 2.2 percent before seasonal adjustment. The indexes for shelter, apparel, and motor vehicle insurance all rose and contributed to the 1-month seasonally adjusted increase in the all items index. The food index was unchanged in February, as a decline in the index for food at home offset an increase in the food away from home index. The energy index increased slightly, with its component indexes mixed. The index for all items less food and energy increased 0.2 percent in February following a 0.3-percent increase in January. Along with shelter, apparel, and motor vehicle insurance, the indexes for household furnishings and operations, education, personal care, and airline fares also increased in February. In contrast, the indexes for communication, new vehicles, medical care, and used cars and trucks declined over the month. The all items index rose 2.2 percent for the 12 months ending February, a slightly larger increase than the 2.1-percent rise for the 12 months ending January. The index for all items less food and energy rose 1.8 percent over the past year, while the energy index increased 7.7 percent and the food index advanced 1.4 percent.”
So although we calculate the annual inflation rate “before seasonal adjustment” as 2.21% the BLS rounds it to 2.2%.
Misery Index
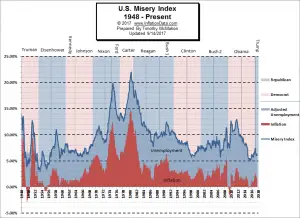 The misery index as of March 2018 (based on the most recent official government inflation and unemployment data for the 12 months ending in February) is at 6.31% (4.1% unemployment and 2.21% inflation) still below the from 6.43% in September 2017 but above the October-January and still about half of the peak of 12.87% in both October and November 2011. [Read More…]
Moore Inflation Predictor
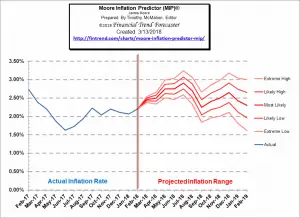
Last month our MIP Chart was projecting a maximum up move to 2.17% so we got a bit more inflation than we were expecting. This month, the MIP is projecting that March will be up fairly sharply and that the upward trend will continue through August.
See Moore Inflation Forecast for more info.
NYSE Rate of Change (ROC)©
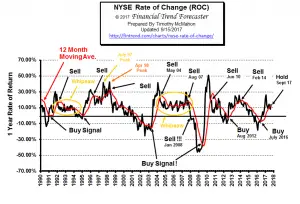
The NYSE index has entered the “Whipsaw period” being above its moving average in November, below in December, above in January, below in February and back up to the moving average in March. In December we said, “However at this point in the cycle we could very well be seeing a whipsaw and with the annual rate of return at 14% we wouldn’t jump to sell too quickly.” Which is why we have labeled it “Hold”.
The sell-off in February left the annual rate of return on the NYSE at 10.36% with a monthly rate of return at -4.78% but in March the Annual rate of return rebounded to 12.56% and the monthly rate of return was 2.54%. If history is any indication this “whipsaw” period could last quite a bit longer with annual rates of return hovering around current levels.
See what the falling NYSE ROC means for you now.
NASDAQ Rate of Change (ROC)©
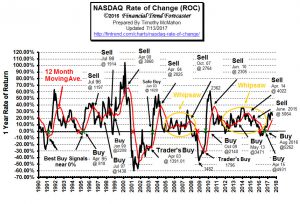
The NASDAQ continues to outperform the NYSE. The annual return for the NASDAQ is 29.56% up from 21.67% last month. On the other hand, the NYSE is 12.56% up from around 10% last month. The NYSE rose 2.54% since last month, while the NASDAQ rose 8.36% over the previous month.
See NASDAQ ROC for more.
You Might Also Like:
- From InflationData.com
- Annual Inflation Rates Not Uniform Throughout the Country
- Hyperinflation: 5 Currencies that Self-Destructed
- Ways Inflation Affects the Real Estate Market Pt. 2
- Ways Inflation Affects the Real Estate Market
- The Quantity Theory of Money
From UnemploymentData.Com
- 4 Educational Paths for Those Interested in Career Leadership Roles
- Work Got You Down? 4 Steps to Making a Career Change
- Pursuing a Healthcare Career
- How to Pick the Right University so You Can Get the Career You Want
- Hard Day’s Work: 4 Ways to Prepare for Working a Construction Job
From Financial Trend Forecaster
- A Correction or a New Bear Market?
- Clean Oil That Only Costs $20 per Barrel?
- Oil Prices Ravaged By Financial Turmoil
- Could Oil Go to $100 a Barrel by 2019?
- Work From Home Trends To Expect In 2018
From Elliott Wave University
- Was the 1,175 Point Drop in the DOW Unpredictable?
- Urgent Message: Two Must See NASDAQ Charts
- Bitcoin Crashes Below $10,000. What’s Next?
- Stocks Can’t Keep Going Up Forever… Or Can They?
From OptioMoney.com
- 6 Budgeting Pointers to Get Your Finances Back on Track
- What Impact Does Divorce Have on Your Finances?
- How to Check Your Credit Score Before Applying for a Mortgage
- Rising Responsibility: 3 Signs You’re Ready to Take on a Mortgage
- How Pro Homeowners Pay off Their Mortgage Faster Than Their Neighbors
From Your Family Finances

Leave a Reply