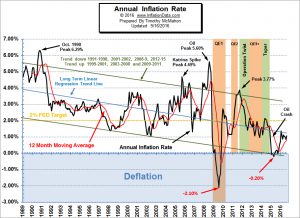
The U.S. Bureau of Labor Statistics (BLS) released their monthly inflation report for August on September 16th. According to the BLS Annual Inflation rose from 0.84% in July to 1.06% in August bringing inflation back in line with the levels in April through June. Inflation was 1.13% in April, 1.02% in May, and 1.01% in June. However, the rise was not due to high monthly inflation. Monthly inflation was only 0.09% for August 2016. Rather annual inflation rose because August 2015’s -0.14% fell out of the equation.
Interestingly, if last month’s monthly inflation of -0.16% .was swapped with this month’s 0.09% the Annual Inflation rate would have been much more stable. The rate would look like this, June 1.01%, July 1.08%, August 1.06%. Basically, the blip down occurred because the deflation (negative inflation) occurred in August last year and a month earlier this year.
For the year food at home was down -1.9%, energy was down -9.2%, and used cars and trucks were down -4.0%. However, Medical care commodities was up 4.5%, Transportation Services was up 3.1%, Housing was up 3.4%, Apparel was up 0.3% and Medical Care Services was up 5.1%.
Current Annual Inflation Chart
 Our current annual inflation chart shows that the recent declines in the Inflation Rate have left it barely above its 12 month moving average. A move below the moving average would indicate that the trend has turned deflationary once again. Read more Information on Current Inflation…
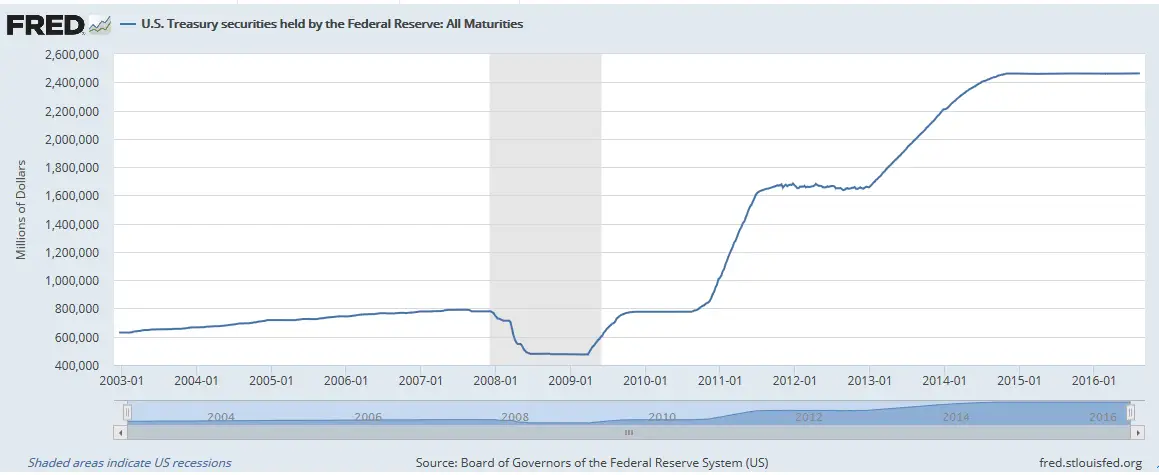
The following chart shows Federal Reserve holdings of U.S. Treasury securities. You will remember that Quantitative Easing (QE) is just a fancy term for the Federal Reserve buying Treasury Securities. So rather than the market absorbing the government debt it is held by the FED. This slight of hand is generally inflationary. It is like one hand writing an IOU to the other hand and then going out and spending the IOU. It creates money out of thin air. When the FED starts selling its Treasury securities on the open market that is deflationary.
But we can see that although the inflation rate is falling the FED has not sold the Treasury Securities it bought it has simply stopped buying more. This shows us how strong the deflationary forces are.
U.S. Treasury Securities Held By the Federal Reserve
 And this massive build up in debt has only achieved one of the most anemic recoveries in history.
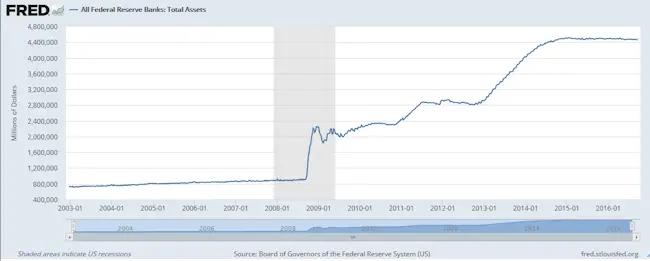
In addition to Treasury Securities the Federal Reserve bought lots of other debt some good, some pretty much worthless but it still holds it on its balance sheets.
Federal Reserve Total Assets
From this chart we can see that the Federal Reserve has a total of just under 4.5 Trillion in assets and if we compare that to the previous chart we can see that about 2.5 Trillion is in Treasuries. Another interesting feature to note is that FED assets rose sharply in the middle of the recession but holdings of Treasuries didn’t increase showing that it was buying up stuff other than treasuries.
Source:
- U.S. Treasury securities held by the Federal Reserve: All Maturities (TREAST)
- All Federal Reserve Banks: Total Assets (WALCL)


Leave a Reply