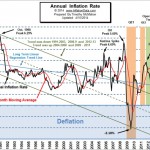
The current CPI for the month of March was 236.293 which resulted in monthly inflation being up 0.64% in the month of March causing the Annual inflation rate to rebound from 1.13% up to 1.51% nearly reaching January’s 1.58%. And the Moore Inflation Predictor’s inflation forecast is for another huge jump this month taking the inflation rate to over 2%.
In other news:
We are in the process of upgrading and redesigning the site in an effort to make it easier to use and as my webmaster says “more responsive” which means that if you have a tablet or even a smart phone you should be able to read it easier. If you are on a full sized screen and want to see what happens you can drag the side of your window smaller and watch as the site adjusts to the smaller screen size. It’s not perfect but is kind of cool to watch. I guess I’m getting old. Another new feature is our scrolling ticker bar at the top of the page which takes the place of our inflation box. This should give us a bit more space. We have also rearranged the navigation and pull-down menus so we apologize to our long time visitors it may take a bit of getting used to but hopefully it will make navigation easier in the long run. And you may still find some old style pages here and there but we are working on it, so give us time…
Back to Inflation News:
The big gainers in inflation this month were Energy with the cost of gas going up 5.1% in a single month and Natural Gas up a whopping 7.1% for the month and 16.4% annually. Other big gainers were food items in the category of “Meat, Poultry, Fish and Eggs” which was up 1.2% for the month, and Dairy products which were up 1%. Airfares were up 1.6% and hospital services were also up 0.5%.
 Looking at the Annual Inflation rate chart we can see the jump in the inflation rate. (Click the chart to see the full article and a larger version of the chart). From this chart you can see the effects of Quantitative Easing in the orange shaded regions and that although QE1 and QE2 resulted in a rebound in inflation so far QE3 has had little or no effect. Although as we mentioned above the Moore Inflation Predictor is forecasting a rather large jump over the next two or three months.
The Misery Index
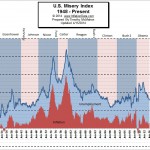
 The misery index is up with the official unemployment rate flat for the month at 6.7% but the inflation rate is up from 1.13% to 1.51% taking the misery index from 7.83% to 8.21% although some recent research indicates that unemployment should be more heavily weighted than inflation. The recent report called “Preferences over Inflation and Unemployment: Evidence from Surveys of Happiness found that unemployment causes 1.7 times as much misery as inflation and so the misery index should actually be calculated by multiplying unemployment by 1.7 and then adding it to inflation. This additional weighting would indicate why this recent recession with low inflation but high unemployment has been harder than the numbers would indicate.
NYSE ROC
Last month we said, “The New York Rate of Change chart has generated a sell signal which we are taking seriously.” And in the month since, the market has been quite volatile showing some weakness, so caution is still advised.
NASDAQ ROC
Last month, NASDAQ was still in buy territory and we said, “but the most recent peak is looking very scary. Caution is advised.” and this month it has generated a sell signal and the similarity in the chart pattern is eerily similar to the peak in 2008. Sell signals are rare, so we definitely pay attention and so we are out of the market and playing it cautious.
You may also like:
- Monthly Inflation Rate
- Cumulative Inflation Calculator or Inflation Calculator
- Pushing on a String, Velocity of Money and Money Multiplier Conspire Against the FED
- Velocity of Money and Money Multiplier- Why Deflation is Possible
- U.K. Historical Price Converter
- Is the Federal Reserve Right About Inflation?
- What is Hyperinflation?


Leave a Reply