
• Home
  • Related Sites
    • Financial Trend Forecaster
      • Moore Inflation Predictor
      • NYSE Rate of Change (ROC)
      • NASDAQ Rate of Change (ROC)
      • Crypto ROC- BTC & ETH
    • Unemployment Data
      • Historical Employment Data
      • Unemployment Rate Chart
      • Labor Force Participation Rate
    • Optio Money
    • Elliott Wave University
    • More Resources
  • Definitions
    • What is Inflation?
    • What is Core Inflation?
    • Inflation vs CPI
    • What is Deflation?
    • What is Disinflation?
    • What is Agflation?
    • What is Stagflation?
    • What is Hyperinflation?
    • What is Quantitative Easing?
    • What is Quantitative Tightening?
    • What is Velocity of Money?
    • What is Fiat Currency?
    • How Do I Calculate Inflation?
    • What are “Sticky Prices” and Why Do They Matter?
  • Featured Content
  • About Us
  • Feedback
    • Sitemap
  • Subscribe Now

InflationData.com

Your Place in Cyber Space for Inflation Data

CPIWidget-July26
  • Numerical Inflation Data
    • Current Inflation Rate
    • Monthly Inflation Rate (Moved)
    • Historical U.S. Inflation Rates
    • Historical CPI
  • Inflation Charts
    • Ann. Inf. Rate Chart
    • Long Term Inflation >
      • Ave. Inf. by Decade
      • Total Inf. by Decade
      • Inflation 1913-1919
      • Inflation 1920-1929
      • Inflation 1930-1939
      • Inflation 1940-1949
      • Inflation 1950-1959
      • Inflation 1960-1969
      • Inflation 1970-1979
    • Cumulative Inflation
    • FED Monetary Policy and Inflation
    • Inflation and Recession
    • Confederate Inflation (1861 – 1865)
    • Misery Index
    • The 3 Stages of Inflation
    • 15-Yr Inflation Trends Chart
  • Inflation Calculators
    • Cumulative Inf. Calc.
    • How Much Would it Cost
    • Historical Inflation Calculator since 1774
    • Salary Inf. Calc.
    • U.K. Inf. Calc.
    • Cost of Gas Calc.
    • Net Worth Calc.
    • Lifetime Earnings Calc.
    • Savings Goal Calc.
    • Financial Calculators
  • Inf. Adjusted Prices
    • Energy >
      • Inflation Adj. Gas Prices
      • Historical Oil Prices Chart
      • Crude Oil Price (Table)
      • Natural Gas Prices
      • Electricity Prices
      • Oil vs Gold
    • Gold >
      • Inflation Adjusted Annual Average Gold Prices
      • Gold is a “Crisis Hedge” not an  “Inflation Hedge”
      • Comparing Oil vs. Gold
    • Corn Prices
    • Education Inflation
    • Housing Prices
    • Mortgage Rates
    • NYSE Index
    • Inf. Indexed Bonds
    • Movie Revenues
    • Inflation-Adjusted Wages
  • Cost of Living
    • Calculate Cost of Living
    • Cost-of-living Adj. (COLA)
    • Consumer Price Index CPI
      • Historical CPI
      • Current CPI
      • CPI Release Dates
    • Gas Prices >
      • Cost of Gas
      • Cost of Gas Per Month
      • Gas vs. Oil Price Chart
    • Food Prices 1913 vs 2013
    • Health Insurance
  • Blog
    • Key Inflation Articles
    • International Inflation
    • Historical Inflation Rates for Japan (1971 to 2014)
You are here: Home » Blog » Cost of Living » Cheaper Fuel (Gas) Prices Ahead

Cheaper Fuel (Gas) Prices Ahead

Published on September 16, 2008 Updated on February 1, 2014 by Guest Author Leave a Comment

By Andrew Gordon

The stimulus package has come and gone. And retail sales are once again feeling the pinch.

So, should the government put together a second package for exhausted consumers? After all, if the government can afford to throw $300 billion at Freddie and Fannie, certainly the government can spend another $145 billion to boost spending going into the holidays, right?

But with gas prices going down, maybe we don’t need another stimulus package. I was asked yesterday by CNBC if lower gas prices would help spending and boost the economy. I said it wouldn’t help much.

A quick look at the numbers might suggest otherwise. After all, every penny increase for a gallon of gas equals more than $1 billion in consumer spending over a year (according to Citigroup).

But let’s break down the numbers a little more. 

On June 1st, American households were spending an average of $83 a week for gas. Gas peaked around mid-July along with crude’s peak. American households were spending $86.50 per week for gas. Since then the price of gas has dropped roughly 12 percent to $76. So families are now saving $10 per week from the peak in mid-July.

But gas is still falling. And it’ll continue to fall as crude bursts under the $100 per barrel barrier. Gas is right now averaging $3.65 a gallon. I believe it’ll easily go below $3.50 by the end of the year. That’s another four percent drop. But let’s be conservative and raise gas savings by two percent. So families will be saving $12 per week from now until the end of the year.

There are 12 more weeks to go before the holiday season begins. The savings for families before they hit the stores on “Black Friday”? It’s a grand total of $144.

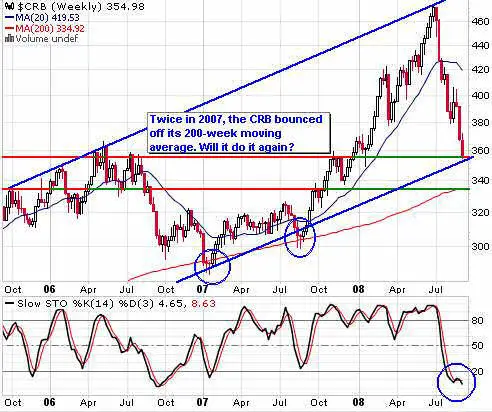
And, mind you, this is not a check you get in the mail. The savings will accrue gradually. People will hardly notice the savings. Of course, they might notice that they’re still paying high prices for food and other goods – despite a drop in commodity prices. Take a look at the CRB commodity index…

Commodity prices are down an average of 25 percent from their peak in June. They’re hitting a support level right now and are oversold (according to the Slow Stochastics).

But with the rest of the planet following the U.S. economy down the toilet, prices could easily continue to fall. The real test will come when (and if) prices fall to the 200-week moving average support at about 340.

They haven’t fallen below that level since mid-2002 when the economy was just coming out of a recession. Of course, back in 2002, you didn’t have trillions of dollars of hedge fund and other institutional money fleeing the commodity markets, either, like you do today. So the drop in commodity prices is happening much earlier in the economic cycle.

These falling prices, however, will take a while to reach the stores. You see, manufacturers have been swallowing the bulk of input price hikes over the past few months when these prices were surging. Now that they’ve fallen back, these companies have a chance to build their profit margins back up.

We’re seeing the same thing with gas prices. Margins for gas refiners have tripled since September 1st.

As much as the Fed likes to see these lower prices (because they help keep a lid on inflation), they do not help the economy grow.

Rather, it’s a sign of no growth or slowing growth. It may feel good to our wallets, but the fact is, when the economy is growing strong, we can afford higher prices. And when it’s going badly – like it is these days – lower prices don’t help much.

With de-leveraging and global growth fading fast, commodities should fall much further. When they find a true bottom, it will be a sign that the worst is behind us. We have a ways to go.

As I’ve said before, a smart move would be to buy more precious metals. They’ve been part of the rundown in prices recently. But as global economic problems deepen, gold should once again be in heavy demand.

Invest well,
Andrew Gordon
CRB Index

This investment news is brought to you by Investor’s Daily Edge. Investor’s Daily Edge is a free daily investment newsletter that is delivered by email before the market opens. It’s published by Fourth Avenue Financial, a subsidiary of Early To Rise  (an affiliate company of Agora Publishing). In each weekday issue you’ll receive practical strategies for protecting your portfolio and multiplying your money. You’ll also learn about undiscovered opportunities in emerging sectors and markets, deeply discounted stocks, recommendations for bonds, cash, commodity and real estate investing, and top ETFs. To view archives or subscribe, visit Investor’s Daily Edge.

Filed Under: Cost of Living, Economy Tagged With: gas prices

Leave a Reply Cancel reply

Your email address will not be published. Required fields are marked *

This site uses Akismet to reduce spam. Learn how your comment data is processed.

Recent Posts

  • June Inflation Down Sharply
  • How Explosive Growth in AI Triggers Inflation
  • Warsh’s First FOMC: No Dot, No Guidance, and No Dovish Pivot
  • May Inflation Up to 4.25%
  • May 2026: BLS April Inflation

Subscribe Now

eTrends Signup Form

A Message from Our Editor

Eliminate Debt

Post Archives

Sponsored:

As a Seasoned Investor I thought I'd seen everything... But recently I discovered TradingView which has really improved the information I have at my fingertips.~ Tim McMahon, editor

TradingView gives me an edge... including powerful charting tools, real-time market data, and a global community of traders—all in one easy to use platform. It has hundreds of indicators, and even custom scripts for more advanced users, and you don't need to change Brokers just use its seamless brokerage integration... TradingView isn't just a charting tool—it's your full trading command center.

Trade smarter. Trade faster. Check Out TradingView for free.

----------

The Best Place to Buy Your Crypto

Coinbase is the largest Crypto Trading platform in the U.S. and the easiest to use. ~Tim McMahon, editor

Check out Coinbase here

Home | Articles | Sitemap | Terms of Service | Privacy | Disclaimer | Advertise With Us

Copyright © 1996-2026 · Capital Professional Services, LLC · Maintained by Design Synergy Studio · Admin

Do Not Sell My Personal Information
