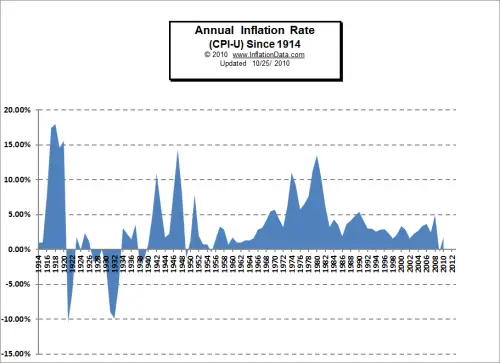
The Bureau of Labor Statistics has been tracking the Consumer Price Index (CPI-U) since 1913. Thus they have been able to calculate the Inflation rate since 1914. And over that period we have seen some major periods of both inflation and deflation as you can see from the chart.
The early years (the teens) were marked by high inflation. The early 1920’s started with deflation and low inflation. The 1930’s of course had the Great Depression and was primarily a period of deflation. World War II ushered in times of massive government spending and nationwide austerity as commodities were rationed and most of the production was directed toward the war effort.
 As the G.I.s returned and wanted to start families, the government started promoting home building programs to satisfy pent up demand. So home building increased, war production shifted to consumer production and the 1950’s were a period of healthy growth. During this period, the inflation rateremained low with a brief dip into deflation in 1955 as the economy stumbled, but this blip is almost undetectable on the chart.
The 1960’s ushered in more growth as the United States embarked on a period of unlimited expectations as we developed electronics and plastics and decided to put a man on the moon. Inflation picked up slightly but primarily remained below 5%.
In the 1970’s the economy stagnated and the inflation rate soared to double digit levels climaxing in 1980 with the price of gold reaching over $800/oz.
As the inflation rate subsided in the 1980’s so did the price of gold. Throughout the 1990’s and the 2000’s the inflation rate has remained relatively moderate staying below 5%.
The deflationary year of 2009 is so small it looks like one of the “tic marks” on the chart.
However, even at those low levels inflation will accumulate and compound. During the thirty year period from January 1980 through January 2010 we experienced 178.52% inflation (see our Inflation Calculator). So we can tell from our, “How much it would cost after Inflation Calculator” on the same page that something that cost $100 in 1980 would cost $278.50 today. So even though the annual rate of inflation may be low, the total combined compound inflation after 30 years is still significant, as prices almost tripled during that period.
The following table gives the average annual inflation rate for the years from 1914-Present.
Annual Inflation Since 1914
| 1914 | 1.01% | 1948 | 8.07% | 1982 | 6.16% | ||
| 1915 | 1.00% | 1949 | -1.24% | 1983 | 3.21% | ||
| 1916 | 7.92% | 1950 | 1.26% | 1984 | 4.32% | ||
| 1917 | 17.43% | 1951 | 7.88% | 1985 | 3.56% | ||
| 1918 | 17.97% | 1952 | 1.92% | 1986 | 1.86% | ||
| 1919 | 14.57% | 1953 | 0.75% | 1987 | 3.65% | ||
| 1920 | 15.61% | 1954 | 0.75% | 1988 | 4.14% | ||
| 1921 | -10.50% | 1955 | -0.37% | 1989 | 4.82% | ||
| 1922 | -6.15% | 1956 | 1.49% | 1990 | 5.40% | ||
| 1923 | 1.79% | 1957 | 3.31% | 1991 | 4.21% | ||
| 1924 | 0.00% | 1958 | 2.85% | 1992 | 3.01% | ||
| 1925 | 2.34% | 1959 | 0.69% | 1993 | 2.99% | ||
| 1926 | 1.14% | 1960 | 1.72% | 1994 | 2.56% | ||
| 1927 | -1.69% | 1961 | 1.01% | 1995 | 2.83% | ||
| 1928 | -1.72% | 1962 | 1.00% | 1996 | 2.92% | ||
| 1929 | 0.00% | 1963 | 1.32% | 1997 | 2.34% | ||
| 1930 | -2.34% | 1964 | 1.31% | 1998 | 1.55% | ||
| 1931 | -8.98% | 1965 | 1.61% | 1999 | 2.19% | ||
| 1932 | -9.87% | 1966 | 2.86% | 2000 | 3.38% | ||
| 1933 | -5.11% | 1967 | 3.09% | 2001 | 2.83% | ||
| 1934 | 3.08% | 1968 | 4.19% | 2002 | 1.59% | ||
| 1935 | 2.24% | 1969 | 5.46% | 2003 | 2.27% | ||
| 1936 | 1.46% | 1970 | 5.72% | 2004 | 2.68% | ||
| 1937 | 3.60% | 1971 | 4.38% | 2005 | 3.39% | ||
| 1938 | -2.08% | 1972 | 3.21% | 2006 | 3.65% | ||
| 1939 | -1.42% | 1973 | 6.22% | 2007 | 2.44% | ||
| 1940 | 0.72% | 1974 | 11.04% | 2008 | 4.94% | ||
| 1941 | 5.00% | 1975 | 9.13% | 2009 | -0.34% | ||
| 1942 | 10.88% | 1976 | 5.76% | 2010 | 1.64% | ||
| 1943 | 6.13% | 1977 | 6.50% | 2011 | 3.16% | ||
| 1944 | 1.73% | 1978 | 7.59% | 2012 | 2.07% | ||
| 1945 | 2.27% | 1979 | 11.35% | 2013 | 1.47% | ||
| 1946 | 8.33% | 1980 | 13.50% | 2014 | NA | ||
| 1947 | 14.36% | 1981 | 10.32% | 2015 | NA |


Leave a Reply