
The Consumer Price Index (CPI) is a widely used economic indicator that measures changes in the prices of goods and services over time. It measures the average change overtime in the prices paid by urban consumers for a market basket of consumer goods and services. Being an index, a date was chosen to be equivalent to 100, and as the price of the goods in the “basket” increased the index increases as well. The percentage difference between the index a year prior and the current index is the inflation rate.
Having a reliable index is an essential tool for policymakers, economists, and individuals alike to assess inflation and make informed decisions. However, there are different variations of the CPI that cater to specific population segments and serve different purposes. There are some differences between the CPI-U (Consumer Price Index for All Urban Consumers) and the CPI-W (Consumer Price Index for Urban Wage Earners and Clerical Workers). By understanding these variations, we can gain a deeper insight into how inflation affects different segments of the population and the implications for economic policy and social welfare.
Consumer Price Index for All Urban Consumers (CPI-U)
The CPI-U, or Consumer Price Index for All Urban Consumers, is the most widely used measure of inflation in the United States. It is designed to capture changes in the cost of living for all urban consumers, regardless of their income levels or employment status. The CPI-U is calculated by tracking the prices of a basket of goods and services that represent the spending patterns of urban households. This basket includes items such as food, housing, transportation, healthcare, and education. The Bureau of Labor Statistics (BLS) collects data from thousands of retail establishments and service providers to determine the average prices of these items. The CPI-U is then calculated based on the weighted average of these prices, with weights assigned according to the expenditure patterns of urban consumers.
According to the BLS, “The CPI market basket is developed from detailed expenditure information provided by families and individuals on what they actually bought. There is a time lag between the expenditure survey and its use in the CPI. For example, CPI data in 2020 and 2021 was based on data collected from the Consumer Expenditure Surveys for 2017 and 2018. In each of those years, about 24,000 consumers from around the country provided information each quarter on their spending habits in the interview survey. To collect information on frequently purchased items, such as food and personal care products, another 12,000 consumers in each of these years kept diaries listing everything they bought during a 2-week period. Over the 2 year period, then, expenditure information came from approximately 24,000 weekly diaries and 48,000 quarterly interviews used to determine the importance, or weight, of the item categories in the CPI index structure.”
Consumer Price Index for Urban Wage Earners and Clerical Workers (CPI-W)
On the other hand, the Consumer Price Index for Urban Wage Earners and Clerical Workers (CPI-W) represents approximately 30 percent of the total U.S. population and is a subset of the CPI-U population. According to the BLS, “The CPI-W also includes a basket of goods and services, but the weights assigned to each expenditure category are based on the spending patterns of wage earners and clerical workers. This means that items such as housing and transportation, which may constitute a larger portion of their expenses, are given more weight in the calculation of the CPI-W.” The data for the CPI-W is collected in a similar manner to the CPI-U, with the BLS tracking prices from retail establishments and service providers that cater to this specific group.
Interestingly, the increase in Social Security benefits is tied to the CPI-W rather than the more common CPI-U.
The Differences
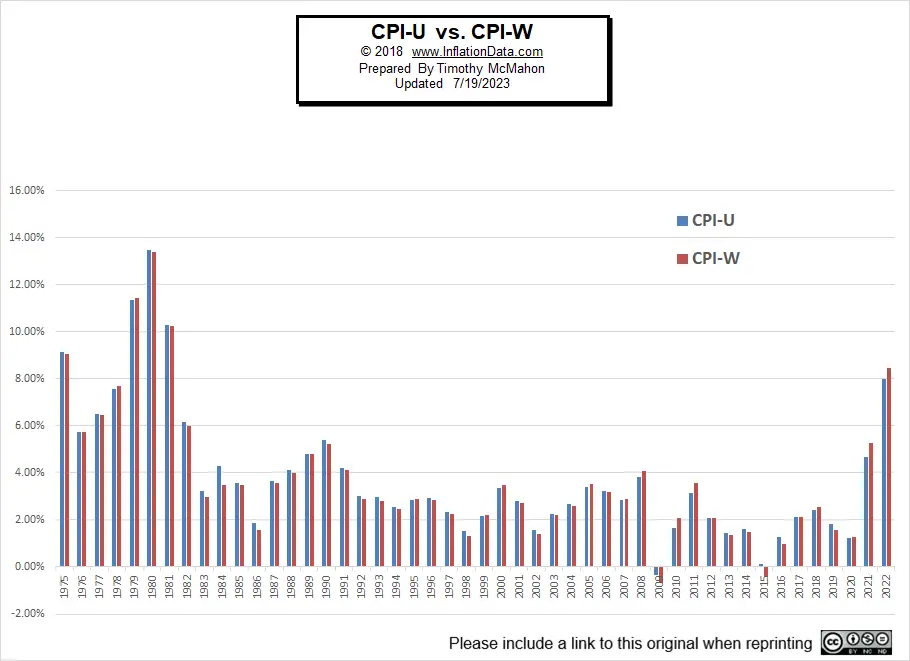
The key differences between the CPI-U and the CPI-W lie in their target populations, the weights assigned to expenditure categories, and their usage and implications. The CPI-U covers all urban consumers, regardless of their occupation or income level, while the CPI-W focuses specifically on urban wage earners and clerical workers. This difference in target population means that the CPI-U provides a more comprehensive measure of inflation for the general population, while the CPI-W offers a more specific measure for a particular segment of workers. Additionally, the weights assigned to expenditure categories differ between the two indices. But as we can see from the chart above and the table below the numbers are fairly similar with CPI-U higher some of the time and CPI-W higher at other times.
| Year | CPI-U | CPI-W | CPI-E |
| 1975 | 9.13% | 9.07% | NA |
| 1976 | 5.76% | 5.73% | NA |
| 1977 | 6.50% | 6.47% | NA |
| 1978 | 7.59% | 7.72% | NA |
| 1979 | 11.35% | 11.43% | NA |
| 1980 | 13.50% | 13.41% | NA |
| 1981 | 10.32% | 10.25% | NA |
| 1982 | 6.16% | 6.02% | NA |
| 1983 | 3.21% | 2.99% | 3.7% |
| 1984 | 4.32% | 3.51% | 4.1% |
| 1985 | 3.56% | 3.48% | 4.1% |
| 1986 | 1.86% | 1.59% | 1.8% |
| 1987 | 3.65% | 3.59% | 4.5% |
| 1988 | 4.14% | 4.00% | 4.5% |
| 1989 | 4.82% | 4.79% | 5.2% |
| 1990 | 5.40% | 5.22% | 6.6% |
| 1991 | 4.21% | 4.11% | 3.4% |
| 1992 | 3.01% | 2.90% | 3.0% |
| 1993 | 2.99% | 2.82% | 3.1% |
| 1994 | 2.56% | 2.46% | 2.7% |
| 1995 | 2.83% | 2.88% | 2.8% |
| 1996 | 2.92% | 2.87% | 3.4% |
| 1997 | 2.34% | 2.27% | 1.8% |
| 1998 | 1.55% | 1.33% | 1.9% |
| 1999 | 2.19% | 2.19% | 2.8% |
| 2000 | 3.38% | 3.49% | 3.6% |
| 2001 | 2.83% | 2.72% | 1.9% |
| 2002 | 1.59% | 1.38% | 2.6% |
| 2003 | 2.27% | 2.22% | 2.1% |
| 2004 | 2.68% | 2.61% | 3.4% |
| 2005 | 3.39% | 3.52% | 3.6% |
| 2006 | 3.24% | 3.19% | 2.7% |
| 2007 | 2.85% | 2.88% | 4.0% |
| 2008 | 3.85% | 4.09% | 0.5% |
| 2009 | -0.34% | -0.67% | 2.2% |
| 2010 | 1.64% | 2.07% | 1.4% |
| 2011 | 3.16% | 3.56% | 2.8% |
| 2012 | 2.07% | 2.10% | 1.8% |
| 2013 | 1.47% | 1.37% | 1.6% |
| 2014 | 1.62% | 1.50% | 1.3% |
| 2015 | 0.12% | -0.41% | 1.0% |
| 2016 | 1.26% | 0.98% | 2.3% |
| 2017 | 2.13% | 2.13% | 2.2% |
| 2018 | 2.44% | 2.55% | 2.0% |
| 2019 | 1.81% | 1.59% | 2.4% |
| 2020 | 1.24% | 1.29% | 1.4% |
| 2021 | 4.69% | 5.26% | 6.4% |
|
2022 |
8.01% | 8.46% | 6.7% |
Indexes and You
The BLS is careful to emphasize that, “The CPI does not necessarily measure your own experience with price change. It is important to understand that BLS bases the market baskets and pricing procedures for the CPI-U and CPI-W populations on the experience of the relevant average household, not of any specific family or individual. For example, if you spend a larger-than-average share of your budget on medical expenses, and medical care costs are increasing more rapidly than the cost of other items in the CPI market basket, your personal rate of inflation may exceed the increase in the CPI. Conversely, if you heat your home with solar energy, and fuel prices are rising more rapidly than other items, you may experience less inflation than the general population does. A national average reflects millions of individual price experiences; it seldom mirrors a particular consumer’s experience.”
Other Indices (Indexes)
The Bureau of Labor Statistics produces other ways of tracking Price Increases, including the Produce Price Index and the Consumer Price Index for the Elderly (CPI-E ), which is a perpetually experimental index designed to track costs for the elderly more accurately than either the CPI-U or CPI-W. And also a Producer Price Index.
Note: CPI-e data source
You might also like:
Consumer Price Index Definition
Why Inflation Affects Various Individuals Differently
Did the Democrats Really Vote Against the Social Security Cost of Living Increase?
Leave a Reply