
The Massive Gap Between Official Turkish Inflation and Reality
The Turkish economy is a trainwreck. Labor is constantly striking for higher wages because inflation is so high. According to the Labor Studies Group, at least 56 worker strikes broke out in Turkey between January 12th and February 10th, and last year the Turkish currency lost 40% of its value against the U.S. Dollar. Interestingly, contrary to all mainstream Economists, Turkey’s President Erdogan insists that lower interest rates fight inflation. So he has kept interest rates artificially low, making the situation worse. Turkey’s falling exchange rate creates a problem for Turkish businesses that get their revenues in lira and owe money in dollars or euros, making it much harder to repay those foreign debts.
In addition to striking for higher wages, ordinary Turks are also turning to Bitcoin as a hedge against the Turkish currency. Back in 2019, we published an article entitled How High Inflation Drives Countries Towards Crypto, and at that time, Turkey’s inflation rate was “only” 20%.
Professor Steve Hanke on Turkey’s Inflation
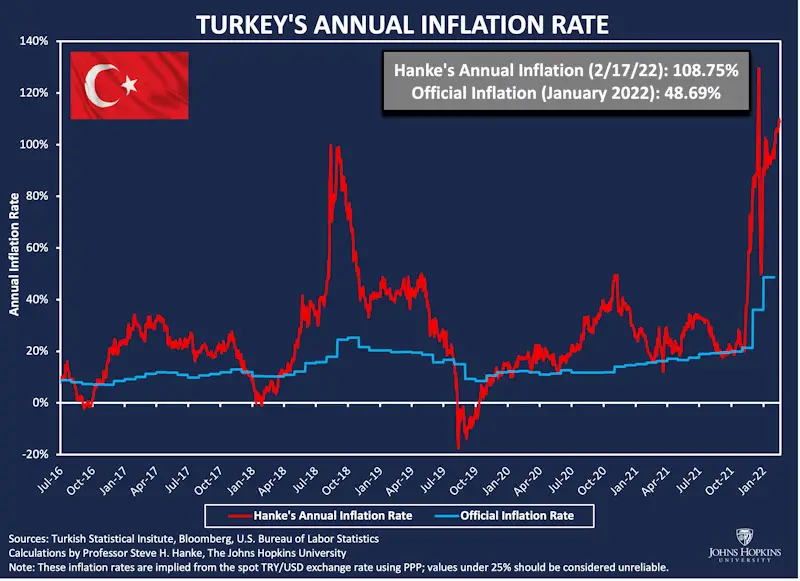
Steve Hanke is a professor of applied economics at Johns Hopkins University in Baltimore. He also specializes in “Troubled Currencies” at the Cato Institute’s Center for Monetary and Financial Alternatives. Hanke has said that finding reliable exchange rate and inflation data for #troubledcurrencies is difficult. So he has begun calculating them himself rather than relying on “official” inflation numbers. The following chart shows Professor Hanke’s Turkish inflation rate compared to the official inflation rate. We can see that the official inflation rate climbed up from 20% last year to almost 49% in January of 2022. If that weren’t bad enough, the unofficial rate was 108.75%. In an interview on Tuesday, Hanke said that President Erdogan’s idea of reducing the VAT tax on food to reduce the inflation tax is wrongheaded. Then he quoted the Nobel Prize-winning monetary economist Milton Friedman by saying, “Inflation is always and everywhere a monetary phenomenon.”
 Even at the official inflation rate, Turkey qualifies as being in hyperinflation. We tend to think of Weimar Germany or Zimbabwe when we think about hyperinflation. But hyperinflation is much more common than most people think. In August 2021, we discussed Turkey’s middle-eastern neighbor, Lebanon, and its hyperinflation. And Syria was in the Throes of Hyperinflation in 2013.
Speaking of Zimbabwe… even though Dollarization rescued Zimbabwe from hyperinflation, now President Mnangagwa has ruled out the use of U.S. dollars for salaries. According to him, “there is no country that prospers without their own currency”. In reality, almost the opposite is true; countries that have control of their own currency are always tempted to inflate their currency because it seems like an easy road to wealth… but instead, it leads to destruction.
Argentina’s Inflation
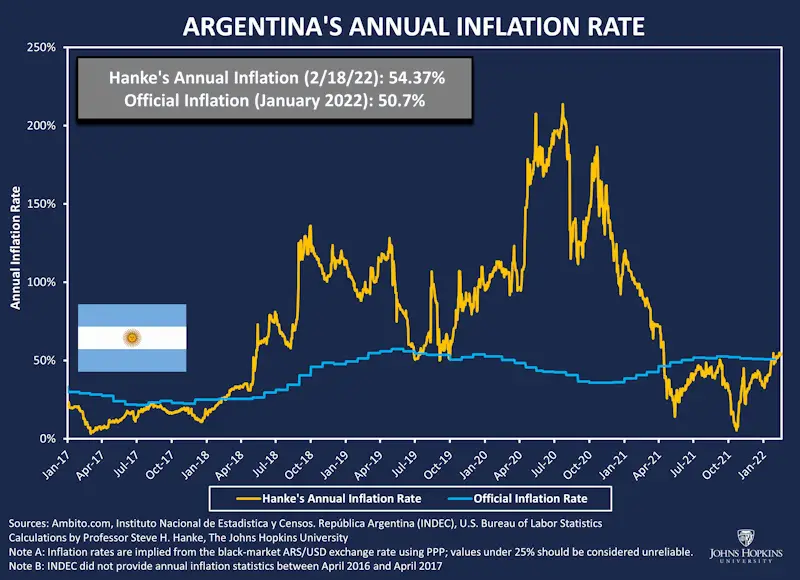
Professor Hanke also tracks Argentina’s inflation which always seems to be in trouble. Interestingly, It has fallen recently and is “only” around 50% right now, down from over 200% only a few months ago. And perhaps more surprisingly, the official inflation rate and Hanke’s inflation rate are actually very close.
On February 17th Hanke posted, “Tuesday marked 6 months since the # Taliban’s takeover of Kabul. During that period, # Afghanistan’s economy has collapsed & inflation has spiked. Today, I measure #inflation in Afg at 29.17%/yr.” He also posted, “Does dollarized El Salvador’s embrace of BTC open a back door for crypto to threaten the U.S. financial system? The ACES Act asks the State Department to find out. Good idea. Now, how about those ‘crypto banks’ in Wyoming?”
The one area where Hanke and I might disagree is in his skepticism for countries turning to Bitcoin. Hanke says, “Crypto is a speculative asset with a fundamental value of zero.”
U.S. Inflation
And that brings us to U.S. inflation. According to Hanke, “Record inflation (7.5%/yr) in the U.S. is caused by record growth of the MONEY SUPPLY (a 39.9% increase since COVID). By choosing to ignore the MONEY SUPPLY, the Fed has made one of the biggest mistakes in its history.”
You might also like:
- What is Hyperinflation?
- Surviving a Hyperinflation
- Confederate Hyperinflation
- Confederate Inflation Rates (1861 – 1865)
- Who Does Inflation Hurt Most?
- What is the Velocity of Money?
Leave a Reply