• Home
  • Related Sites
    • Financial Trend Forecaster
      • Moore Inflation Predictor
      • NYSE Rate of Change (ROC)
      • NASDAQ Rate of Change (ROC)
    • Unemployment Data
      • Historical Employment Data
      • Unemployment Rate Chart
      • Labor Force Participation Rate
    • Your Family Finances
    • Optio Money
    • Elliott Wave University
    • More Resources
  • Definitions
    • What is Inflation?
    • What is Core Inflation?
    • Inflation vs CPI
    • What is Deflation?
    • What is Disinflation?
    • What is Agflation?
    • What is Stagflation?
    • What is Hyperinflation?
    • What is Quantitative Easing?
    • What is Quantitative Tightening?
    • What is Velocity of Money?
    • What is Fiat Currency?
    • How Do I Calculate Inflation?
    • What are “Sticky Prices” and Why Do They Matter?
  • Featured Content
  • About Us
  • Feedback
    • Sitemap
  • Subscribe Now

InflationData.com

Your Place in Cyber Space for Inflation Data

CPI Index

CPIWidget-July 2025
  • Numerical Inflation Data
    • Current Inflation Rate
    • Monthly Inflation Rate
    • Historical U.S. Inflation Rates
    • Historical CPI
  • Inflation Charts
    • Ann. Inf. Rate Chart
    • Long Term Inflation >
      • Ave. Inf. by Decade
      • Total Inf. by Decade
      • Inflation 1913-1919
      • Inflation 1920-1929
      • Inflation 1930-1939
      • Inflation 1940-1949
      • Inflation 1950-1959
      • Inflation 1960-1969
      • Inflation 1970-1979
    • Cumulative Inflation
    • FED Monetary Policy and Inflation
    • Inflation and Recession
    • Confederate Inflation (1861 – 1865)
    • Misery Index
    • The 3 Stages of Inflation
    • 15-Yr Inflation Trends Chart
  • Inflation Calculators
    • Cumulative Inf. Calc.
    • Price Inflation Calc.
    • How Much Would it Cost
    • Salary Inf. Calc.
    • Cost of Living Calc.
    • U.K. Inf. Calc.
    • Cost of Gas Calc.
    • Net Worth Calc.
    • Lifetime Earnings Calc.
    • Savings Goal Calc.
    • Financial Calculators
  • Inf. Adjusted Prices
    • Energy >
      • Inflation Adj. Gas Prices
      • Historical Oil Prices Chart
      • Crude Oil Price (Table)
      • Natural Gas Prices
      • Electricity Prices
      • Oil vs Gold
    • Gold >
      • Inflation Adjusted Annual Average Gold Prices
      • Gold is a “Crisis Hedge” not an  “Inflation Hedge”
      • Comparing Oil vs. Gold
    • Corn Prices
    • Education Inflation
    • Housing Prices
    • Mortgage Rates
    • NYSE Index
    • Inf. Indexed Bonds
    • Movie Revenues
    • Inflation-Adjusted Wages
  • Cost of Living
    • Calculate Cost of Living
    • Cost-of-living Adj. (COLA)
    • Consumer Price Index CPI
      • Historical CPI
      • Current CPI
      • CPI Release Dates
    • Gas Prices >
      • Cost of Gas
      • Cost of Gas Per Month
      • Gas vs. Oil Price Chart
    • Food Prices 1913 vs 2013
    • Health Insurance
  • Blog
    • Key Inflation Articles
    • International Inflation
    • Historical Inflation Rates for Japan (1971 to 2014)
You are here: Home » Blog » Inflation » Japanese Inflation Higher than U.S- First Time Since 1978

Japanese Inflation Higher than U.S- First Time Since 1978

Published on June 28, 2014 by Tim McMahon Leave a Comment

Core inflation in Japan was 3.4% in May while U.S. inflation was officially,  only 2.13%. This was the fastest rise in Japanese prices since April 1982.

In the 1970’s inflation was bad in the U.S., but it was much worse in Japan. Every rise in U.S. inflation was multiplied in Japan, for instance, the average annual U.S. inflation rate, in 1974, was 11.04% while in Japan it was more than twice as high at 23.10%.

But in 1978 a strange thing happened, Japan got its inflation under control and Japanese inflation dropped down to 4.2% while U.S. inflation remained at 7.59%. And by1979, Japanese inflation had fallen to 3.8% while U.S. inflation climbed to 11.35%. In 1980, although Japan had a setback and inflation rebounded to 7.8% U.S. inflation climbed even higher higher to 13.5%.  Then as you can see from the following chart Japanese inflation stayed below U.S. inflation for the next 36 years, until now. US vs Japan inflation 
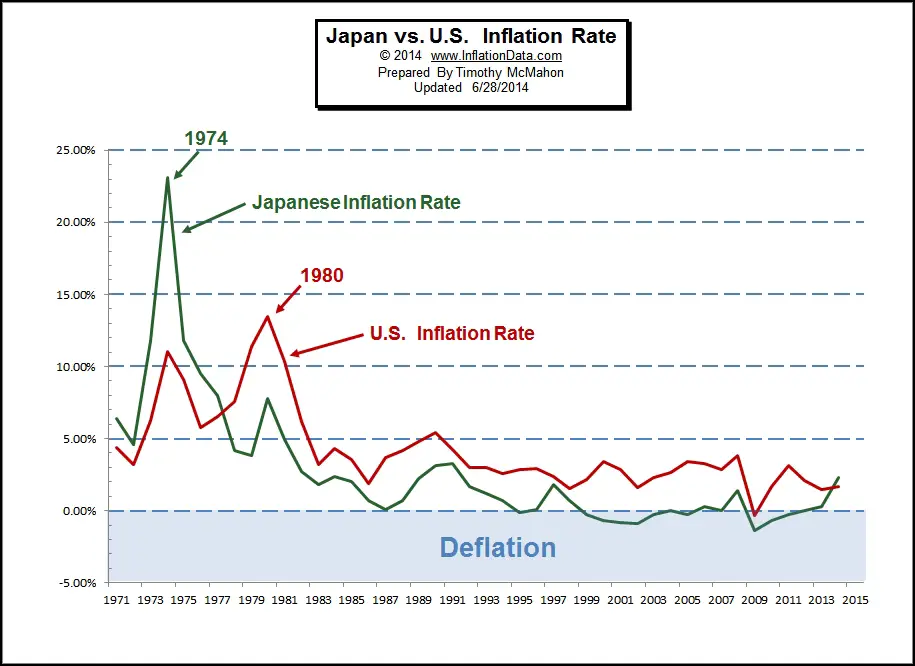
For the first time since, 1978, Inflation in Japan is higher than in the U.S.

Will it continue…   Or will Japanese inflation will fade once more?  Or perhaps the U.S. will boost inflation again in an effort to goose the economy further…

Read more about Japanese Inflation from 1971-2014

Filed Under: Inflation Tagged With: Japan

Leave a Reply Cancel reply

Your email address will not be published. Required fields are marked *

This site uses Akismet to reduce spam. Learn how your comment data is processed.

Latest Posts

  • AI Is Deflationary But Its Energy Demand Could Fuel Inflation
  • June Inflation Up Again
  • FED’s Semiannual Monetary Policy Report
  • What Is the Trimmed Mean CPI and What Is It Good For?
  • May 2025 Inflation Up Slightly
  • The Truth About Why Gold Is Surging
  • April Inflation Down Slightly
  • FED Holds Steady at May Meeting

Sponsored:

5,000 Stocks have a "green day"

Did you know beginning on one particular date each year, McDonald's stock has a 93% history of soaring.

And Tesla has a 100% history of soaring beginning on one particular day every single year.

This phenomenon occurs on 5,000 different stocks. It's a powerful new way to potentially double your money - by foreseeing the biggest stock jumps, TO THE DAY, with 83% backtested accuracy.

See the green days for 7 major stocks right here, free of charge

Subscribe Now

eTrends Signup Form

Elliott Wave News

Post Archives

Home | Articles | Sitemap | Terms of Service | Privacy | Disclaimer | Advertise With Us

Copyright © 1996-2025 · Capital Professional Services, LLC · Maintained by Design Synergy Studio · Admin

Do Not Sell My Personal Information