Inflation like everything else it seems has cycles. It trends up for years and then for almost no reason begins falling again. After a while it rises again.
Unfortunately, while it is doing its long term dance it is bouncing up and down creating so much “noise” that it is difficult to see the longer term trend.
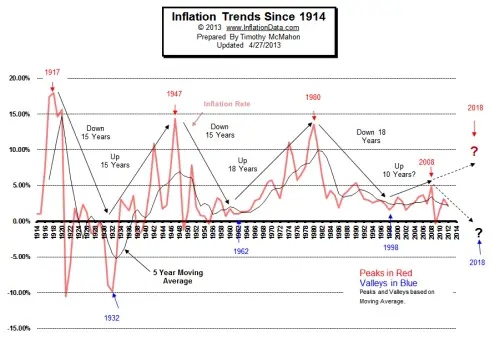
The chart below shows this trend by adding a 5 year moving average to the inflation rate. This smooths out the noise so we can see the underlying trend. And surprisingly it is actually quite regular.
Inflation Cycles Approx. Every 15 Years
From the chart we can see that beginning in 1917 we had 15 years of declining inflation until the bottom in 1932. From there inflation increased for 15 years until 1947. Read More


Leave a Reply