
The 1990s was a period of transition not only regarding inflation but also politically, as Communist countries failed throughout the world and began turning toward Capitalism. The decade began with the reunification of Germany. In 1990 the Deutsche Demokratische Republik, (East Germany) and the Bundesrepublik Deutschland, (West Germany) united to form the reunited nation of Germany.
Where it Began
In 1987 Soviet President Gorbachev visited the U.S. to negotiate a long-range nuclear arsenal treaty with U.S. President Ronald Reagan. During this visit, it is reported that Gorbachev wanted to visit a typical U.S. grocery store. Upon seeing the vast variety and selection available to ordinary U.S. citizens, he is reported to have said “the Soviet Union is doomed“. At the time the shelves of Soviet grocery stores often had limited supply and only the “elite” stores had any selection and most of that was produced in capitalist countries (or taken by force from Soviet Satelite countries). Ordinary Soviet citizens often waited in long lines to get staples like bread and eggs. In 1989, revolts began against communist regimes across Eastern Europe and China. In China, the government refused to negotiate with student protestors, resulting in the Tiananmen Square attacks that stopped the revolts by force.
The transition was not easy, however, and by 1990, Soviet leader Mikhail Gorbachev’s reforms were causing major inflation and economic chaos. It got so bad that hard-line Communists attempted a failed coup in August 1991, marking the effective end of the Soviet Union. All its constituent republics declared their independence by 1991, and on Christmas, Gorbachev resigned from office. After 73 years, the Soviet Union had ceased to exist.
A new Russian Federation was formed, headed by Boris Yeltsin, but the transition was far from painless. The ordinary people were used to having a “Nanny State” and really didn’t know how to compete. Almost half the country was in poverty. Yeltsin had a 3% approval rating, so to win reelection in 1996 he bought the support of the oligarchs by allowing them to take over Russia’s energy and industrial sectors. Economic turmoil and devaluation of the ruble continued, and on the last day of 1999, Yeltsin resigned handing power to Vladimir Putin.
The U.S. on the other hand was prospering under Reagan’s laissez-faire capitalism policies. Reagan reduced government intervention, lowered taxes, and deregulated markets. More economic freedom combined with the advent of the Internet and the explosion of computer technology resulted in an economic boom. A major factor in the computer boom was the fact that when IBM developed their first PC back in 1981 they used off-the-shelf parts available at Radio Shack, so free enterprise created Clone Computers that became readily available at ever-cheaper prices. Thus the U.S. and Canadian economies experienced their longest period of peacetime economic expansion during the decade of the 1990s. Personal incomes doubled from the recession in 1990, and there was higher productivity overall.
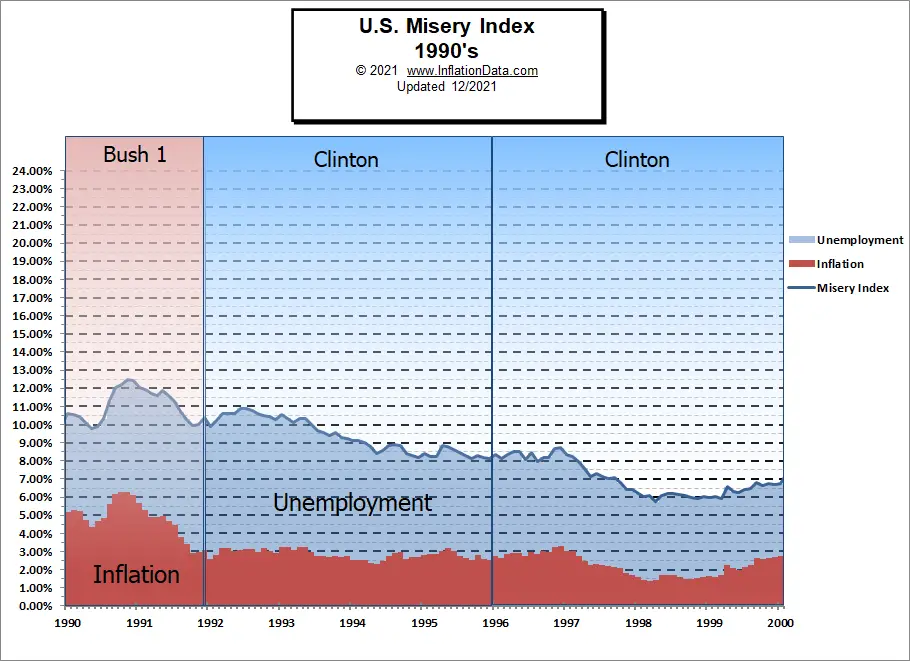
The Misery Index
The “misery index” is a “quick and dirty” measure of the well-being of the general populous. It is calculated by simply adding the unemployment rate on top of the inflation rate. The 1990s saw an improving misery index. Under George Bush, inflation fell from around 5-6% to around 3% but unemployment grew from around 5.5% to about 7%. Under Bill Clinton, inflation remained low but unemployment fell until 1998 when it gradually began increasing again. It is interesting to note that a major factor in the low inflation of the 1990s had its seeds in Nixon’s China visit and Reagan’s belief in laissez-faire capitalism.
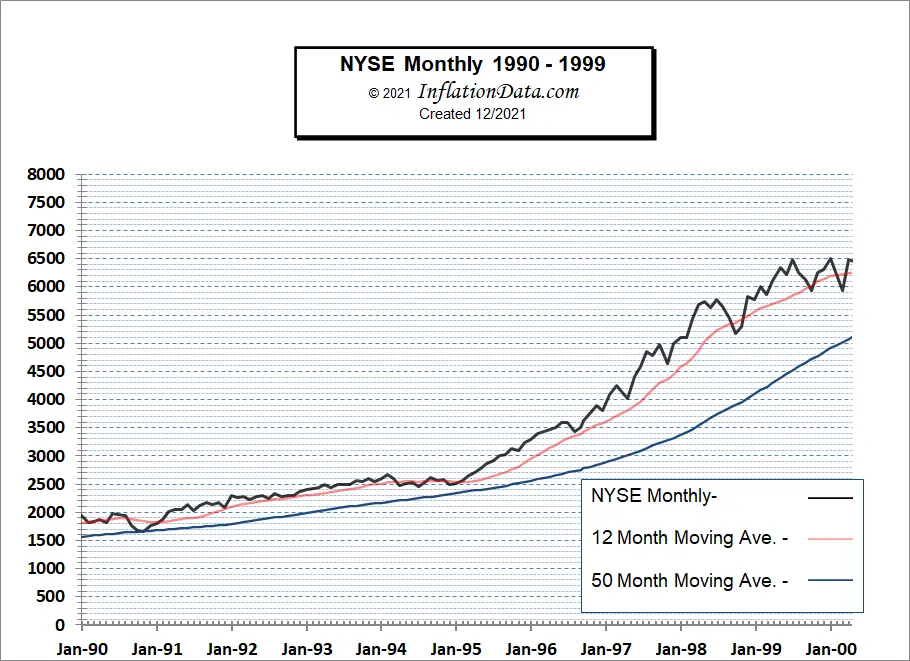
 The Stock Market of the 1990s
The NYSE began the ’90s around 2000 and gradually climbed to around 2500 by 1995. But then it skyrocketed to 6500, more than tripling by the end of the decade.
The Consumer Price Index CPI from 1980 – 1989
| Year | Jan | Feb | Mar | Apr | May | Jun | Jul | Aug | Sep | Oct | Nov | Dec | Ave. |
| 1990 | 127.4 | 128.0 | 128.7 | 128.9 | 129.2 | 129.9 | 130.4 | 131.6 | 132.7 | 133.5 | 133.8 | 133.8 | 130.7 |
| 1991 | 134.6 | 134.8 | 135.0 | 135.2 | 135.6 | 136.0 | 136.2 | 136.6 | 137.2 | 137.4 | 137.8 | 137.9 | 136.2 |
| 1992 | 138.1 | 138.6 | 139.3 | 139.5 | 139.7 | 140.2 | 140.5 | 140.9 | 141.3 | 141.8 | 142.0 | 141.9 | 140.3 |
| 1993 | 142.6 | 143.1 | 143.6 | 144.0 | 144.2 | 144.4 | 144.4 | 144.8 | 145.1 | 145.7 | 145.8 | 145.8 | 144.5 |
| 1994 | 146.2 | 146.7 | 147.2 | 147.4 | 147.5 | 148.0 | 148.4 | 149.0 | 149.4 | 149.5 | 149.7 | 149.7 | 148.2 |
| 1995 | 150.3 | 150.9 | 151.4 | 151.9 | 152.2 | 152.5 | 152.5 | 152.9 | 153.2 | 153.7 | 153.6 | 153.5 | 152.4 |
| 1996 | 154.4 | 154.9 | 155.7 | 156.3 | 156.6 | 156.7 | 157.0 | 157.3 | 157.8 | 158.3 | 158.6 | 158.6 | 156.9 |
| 1997 | 159.1 | 159.6 | 160.0 | 160.2 | 160.1 | 160.3 | 160.5 | 160.8 | 161.2 | 161.6 | 161.5 | 161.3 | 160.5 |
| 1998 | 161.6 | 161.9 | 162.2 | 162.5 | 162.8 | 163.0 | 163.2 | 163.4 | 163.6 | 164.0 | 164.0 | 163.9 | 163.0 |
| 1999 | 164.3 | 164.5 | 165.0 | 166.2 | 166.2 | 166.2 | 166.7 | 167.1 | 167.9 | 168.2 | 168.3 | 168.3 | 166.6 |
Annual Inflation from 1980 – 1989
| Year | Jan | Feb | Mar | Apr | May | Jun | Jul | Aug | Sep | Oct | Nov | Dec | Geo. Mean |
| 1990 | 5.20% | 5.26% | 5.23% | 4.71% | 4.36% | 4.67% | 4.82% | 5.62% | 6.16% | 6.29% | 6.27% | 6.11% | 5.39% |
| 1991 | 5.65% | 5.31% | 4.90% | 4.89% | 4.95% | 4.70% | 4.45% | 3.80% | 3.39% | 2.92% | 2.99% | 3.06% | 4.25% |
| 1992 | 2.60% | 2.82% | 3.19% | 3.18% | 3.02% | 3.09% | 3.16% | 3.15% | 2.99% | 3.20% | 3.05% | 2.90% | 3.03% |
| 1993 | 3.26% | 3.25% | 3.09% | 3.23% | 3.22% | 3.00% | 2.78% | 2.77% | 2.69% | 2.75% | 2.68% | 2.75% | 2.95% |
| 1994 | 2.52% | 2.52% | 2.51% | 2.36% | 2.29% | 2.49% | 2.77% | 2.90% | 2.96% | 2.61% | 2.67% | 2.67% | 2.61% |
| 1995 | 2.80% | 2.86% | 2.85% | 3.05% | 3.19% | 3.04% | 2.76% | 2.62% | 2.54% | 2.81% | 2.61% | 2.54% | 2.81% |
| 1996 | 2.73% | 2.65% | 2.84% | 2.90% | 2.89% | 2.75% | 2.95% | 2.88% | 3.00% | 2.99% | 3.26% | 3.32% | 2.93% |
| 1997 | 3.04% | 3.03% | 2.76% | 2.50% | 2.23% | 2.30% | 2.23% | 2.23% | 2.15% | 2.08% | 1.83% | 1.70% | 2.34% |
| 1998 | 1.57% | 1.44% | 1.37% | 1.44% | 1.69% | 1.68% | 1.68% | 1.62% | 1.49% | 1.49% | 1.55% | 1.61% | 1.55% |
| 1999 | 1.67% | 1.61% | 1.73% | 2.28% | 2.09% | 1.96% | 2.14% | 2.26% | 2.63% | 2.56% | 2.62% | 2.68% | 2.19% |
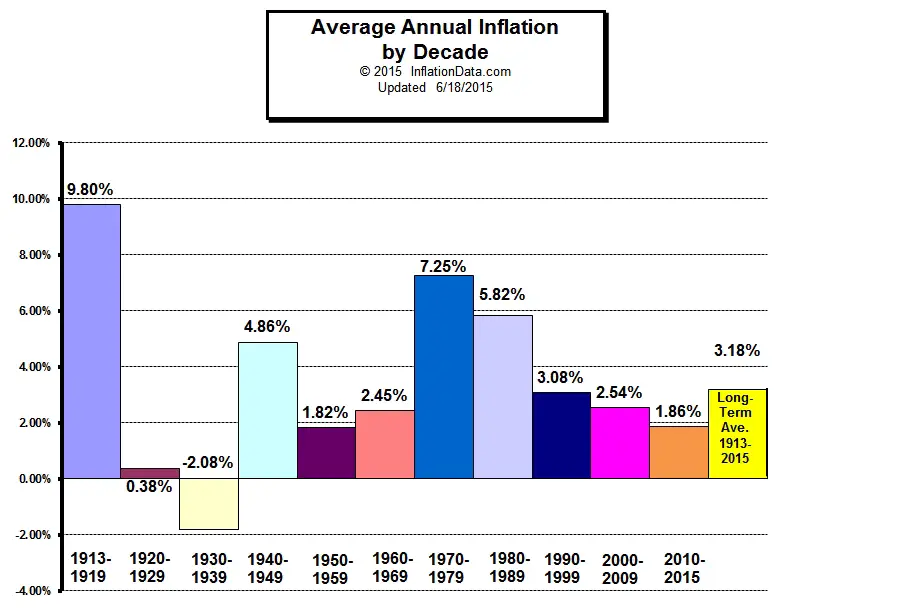
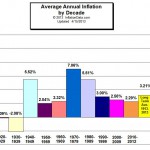
From the Average Annual Inflation by Decade chart, we can see that the average Inflation for the 1990s was 3.08%, which is very close to the long-term average of 3.18%.
Click Image for more information
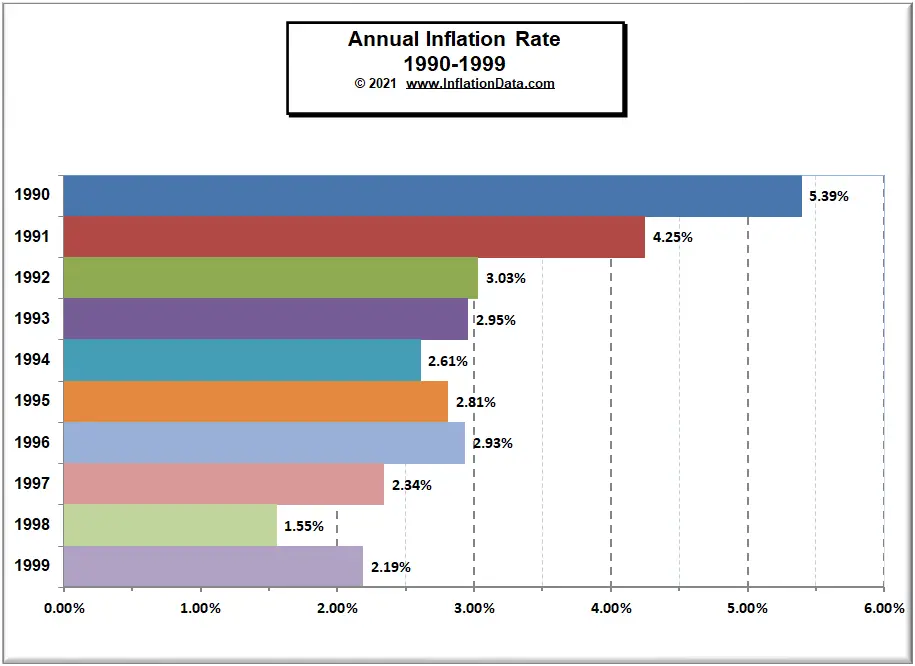
Inflation Chart 1990- 1999
The following chart shows the inflation rates during the period from 1990-1999. Inflation in the 1990s started above 5% and ended around 2%.
See Also:
 |
 |
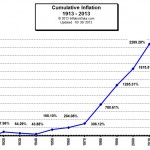 |
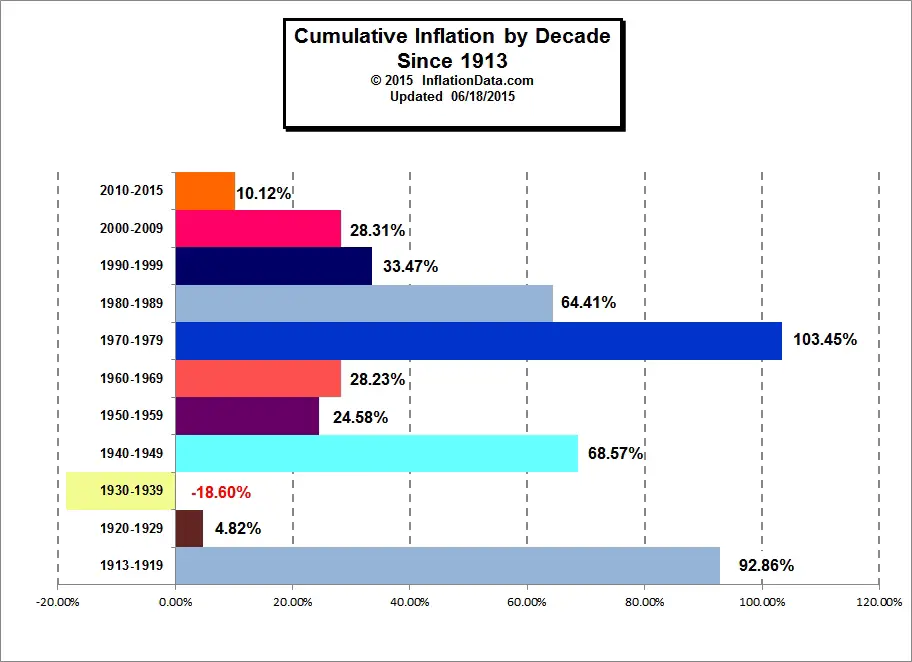
| Average Annual Inflation by Decade | Total Inflation by Decade | Total Cumulative Inflation |
- Inflation and Consumer Price Index- Decade Commentary
- WWI – The beginning of the of the CPI the Inflationary period 1913 – 1919
- The “Roaring Twenties” Inflation and Deflation 1920-1929
- The Great Depression and the Deflationary 1930′s– 1930-1939
- World War II — the volatile 1940′s– High and Low Inflation 1940-1949
- The 1950′s “Happy Days”– Inflation and CPI 1950-1959
- The 1960′s the age of possibility– Low Inflation 1960-1969
- The Inflationary 1970’s Inflation and CPI 1970-1979
- The Reagan Era Lower Inflation 1980-1989
- The Decade of Free Enterprise 1990-1999 – This article