
Inflation During the “Roaring 20’s”
The period from January 1, 1920 through December 31, 1929 in the United States was called the “Roaring 20’s” but all was not roses. This was considered the decade of economic recovery from the high inflation and wartime devastation of the teens but there were a few thorns. The “roaring twenties” began with a depression. Inflation in 1920 was a deflationary -1.55%. 1921 the first year of Warren Harding’s presidency saw prices decline -11.05% and by 1922 prices were basically flat losing only -0.59%.
It is hard to believe today, but when the income tax was first established in 1913, (coincidentally the first year that we have official inflation data for) the average person paid only 1% or less and highest marginal tax rate on those making over $500,000 was only 7 percent! But it didn’t take long for the government to crank it up. By 1917 the lowest bracket was 2% and those making over $2,000,000 had to pay a whopping 67 percent to help finance World War I. After the war was over, President Harding started the ball rolling on reducing the tax rates and by 1925 top rate taxpayers “only” paid 1/4 (i.e. 25%) rather than 2/3rds (i.e. 67%).
One of the primary reasons the 1920’s are considered “roaring” is due to F. Scott Fitzgerald’s classic novel, The Great Gatsby which illustrated the lives of the rich but did not reflect the everyday lives of the average family. It was a great time to be rich as tax rates were coming down and investors enjoyed a booming stock market.
However, not everyone enjoyed the boom. Over 50% of the American population still lived on farms, and didn’t own stocks. The twenties was a terrible time for farmers. World War I had allowed farmers in the U.S. to boost production to feed war torn Europe. To meet this increased demand many farmers had taken out large loans to buy tractors and increase acreage under cultivation. But as the war ended, European farmers began producing again and American farmers suddenly faced a glut of agricultural products which resulted in falling prices (deflation) for commodities like corn, wheat and cotton. For many in rural America the Great Depression began not with the stock market crash in 1929 but a full ten years earlier with the agricultural product crash in 1920. The 1920’s had a much greater divide between “haves” and “have-nots” than we have today. There was a great divide between the prosperity of the cities and the poverty of the country. And for those in the country the poverty continued for roughly two decades from 1920 through 1940.
The Consumer Price Index CPI from 1920 – 1929
The following table shows the Consumer Price index for the ten years from 1920 through 1929 based upon a 1982-84 base of 100.
| Year | Jan- | Feb- | Mar- | Apr- | May- | Jun- | Jul- | Aug- | Sep- | Oct- | Nov- | Dec- |
| 1920 | 19.3 | 19.5 | 19.7 | 20.3 | 20.6 | 20.9 | 20.8 | 20.3 | 20.0 | 19.9 | 19.8 | 19.4 |
| 1921 | 19.0 | 18.4 | 18.3 | 18.1 | 17.7 | 17.6 | 17.7 | 17.7 | 17.5 | 17.5 | 17.4 | 17.3 |
| 1922 | 16.9 | 16.9 | 16.7 | 16.7 | 16.7 | 16.7 | 16.8 | 16.6 | 16.6 | 16.7 | 16.8 | 16.9 |
| 1923 | 16.8 | 16.8 | 16.8 | 16.9 | 16.9 | 17.0 | 17.2 | 17.1 | 17.2 | 17.3 | 17.3 | 17.3 |
| 1924 | 17.3 | 17.2 | 17.1 | 17.0 | 17.0 | 17.0 | 17.1 | 17.0 | 17.1 | 17.2 | 17.2 | 17.3 |
| 1925 | 17.3 | 17.2 | 17.3 | 17.2 | 17.3 | 17.5 | 17.7 | 17.7 | 17.7 | 17.7 | 18.0 | 17.9 |
| 1926 | 17.9 | 17.9 | 17.8 | 17.9 | 17.8 | 17.7 | 17.5 | 17.4 | 17.5 | 17.6 | 17.7 | 17.7 |
| 1927 | 17.5 | 17.4 | 17.3 | 17.3 | 17.4 | 17.6 | 17.3 | 17.2 | 17.3 | 17.4 | 17.3 | 17.3 |
| 1928 | 17.3 | 17.1 | 17.1 | 17.1 | 17.2 | 17.1 | 17.1 | 17.1 | 17.3 | 17.2 | 17.2 | 17.1 |
| 1929 | 17.1 | 17.1 | 17.0 | 16.9 | 17.0 | 17.1 | 17.3 | 17.3 | 17.3 | 17.3 | 17.3 | 17.2 |
Inflation from 1920 – 1929
By noting the mass of red (deflationary) numbers on this table we can see that the majority of the “roaring twenties” was deflationary in the United States with the prevailing trend being down. But during the same period in Europe some countries were suffering under hyperinflation. The famous Hyperinflation in Weimar Germany started in 1914 but didn’t end until 1923 with a total hyperinflation 1,000,000,000,000 to 1. Hungary also had hyperinflation from 1919-1924 with inflation reaching 98% per month in 1922. And Poland had hyperinflation from 1918-1924 of 800,000 to 1.
| Year | Jan | Feb | Mar | Apr | May | Jun | Jul | Aug | Sep | Oct | Nov | Dec |
| 1920 | 16.97% | 20.37% | 20.12% | 21.56% | 21.89% | 23.67% | 19.54% | 14.69% | 12.36% | 9.94% | 7.03% | 2.65% |
| 1921 | -1.55% | -5.64% | -7.11% | -10.84% | -14.08% | -15.79% | -14.90% | -12.81% | -12.50% | -12.06% | -12.12% | -10.82% |
| 1922 | -11.05% | -8.15% | -8.74% | -7.73% | -5.65% | -5.11% | -5.08% | -6.21% | -5.14% | -4.57% | -3.45% | -2.31% |
| 1923 | -0.59% | -0.59% | 0.60% | 1.20% | 1.20% | 1.80% | 2.38% | 3.01% | 3.61% | 3.59% | 2.98% | 2.37% |
| 1924 | 2.98% | 2.38% | 1.79% | 0.59% | 0.59% | 0.00% | -0.58% | -0.58% | -0.58% | -0.58% | -0.58% | 0.00% |
| 1925 | 0.00% | 0.00% | 1.17% | 1.18% | 1.76% | 2.94% | 3.51% | 4.12% | 3.51% | 2.91% | 4.65% | 3.47% |
| 1926 | 3.47% | 4.07% | 2.89% | 4.07% | 2.89% | 1.14% | -1.13% | -1.69% | -1.13% | -0.56% | -1.67% | -1.12% |
| 1927 | -2.23% | -2.79% | -2.81% | -3.35% | -2.25% | -0.56% | -1.14% | -1.15% | -1.14% | -1.14% | -2.26% | -2.26% |
| 1928 | -1.14% | -1.72% | -1.16% | -1.16% | -1.15% | -2.84% | -1.16% | -0.58% | 0.00% | -1.15% | -0.58% | -1.16% |
| 1929 | -1.16% | 0.00% | -0.58% | -1.17% | -1.16% | 0.00% | 1.17% | 1.17% | 0.00% | 0.58% | 0.58% | 0.58% |
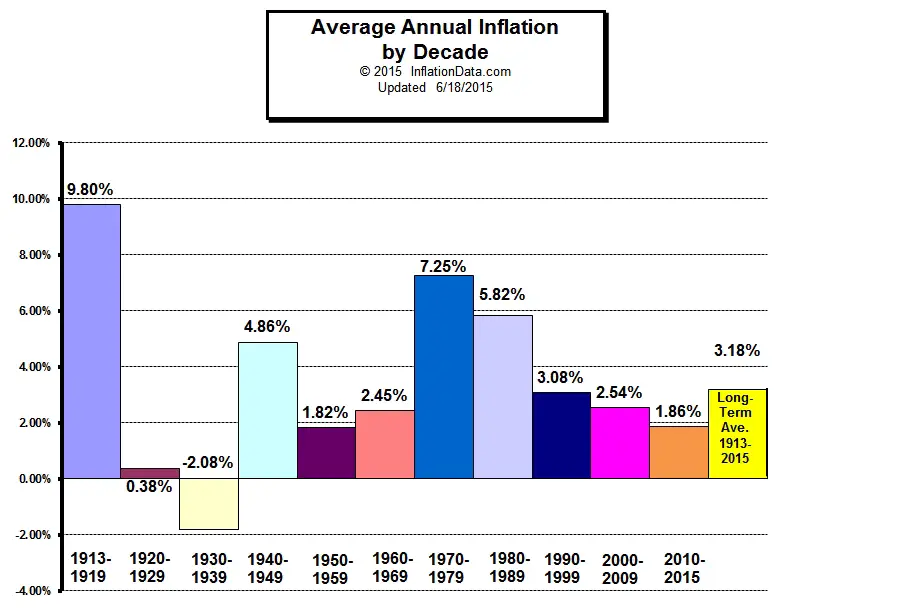
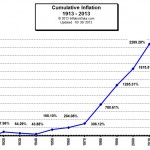
From the Average Annual Inflation by Decade chart we can see that the average inflation for the 1920’s was zero.
Click Image for more information
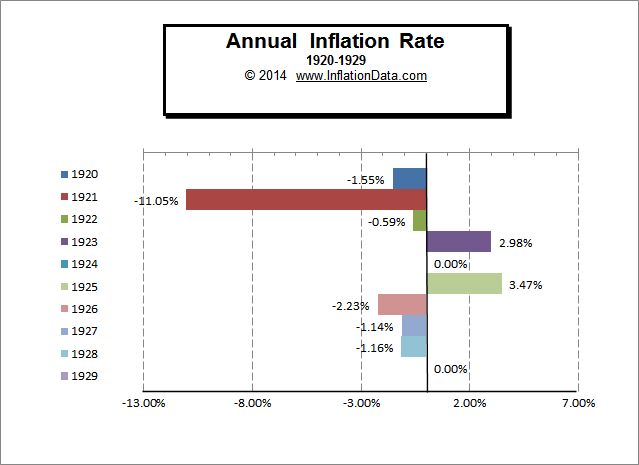
Inflation Chart 1920- 1929
The following chart shows the inflation rates during the period from 1920-1929.
See Also:
 |
 |
 |
| Average Annual Inflation by Decade | Total Inflation by Decade | Total Cumulative Inflation |
- Inflation and Consumer Price Index- Decade Commentary
- WWI – The beginning of the of the CPI the Inflationary period 1913 – 1919
- The “Roaring Twenties” Inflation and Deflation 1920-1929 — This Page
- The Great Depression and The Deflationary 1930s 1930-1939
- World War II — the volatile 1940′s– High and Low Inflation 1940-1949
- The 1950′s “Happy Days”– Inflation and CPI 1950-1959
- The 1960′s the age of possibility– Low Inflation 1960-1969
- The Inflationary 1970’s Inflation and CPI 1970-1979
- The Reagan Era Lower Inflation 1980-1989
- The Decade of Free Enterprise Inflation 1990-1999
Leave a Reply