
By looking at the Inflation-adjusted natural gas prices we are better able to determine the trend and how prices actually compare to previous times. Speaking of natural gas prices… why are residential natural gas prices so cyclical? And why are they higher when the least amount is being used i.e. in the Summer?
Why do Natural Gas Prices Vary So Much Throughout the Year?
The primary reason that residential prices appear to vary so much throughout the year is that when the EIA tracks them they use the final price including taxes and fees. And many of those fees are a “flat rate” service charge. So if you use less natural gas in the summer but pay the same flat fee it appears that your gas cost more. For example, suppose the flat service fee is $20 and gas prices are steady at $10 per 1000 cubic feet for the whole year. In the summer you used 3,ooo cubic feet and in the winter you used 20,000 cubic feet.
In the summer your bill would be ($10 x 3) + $20 = $50 for a cost per 1,000 cubic foot of $50/3= $16.67
But in the winter your bill would be ($10 x 20) + $20 = $220 for a cost per 1,000 cubic foot of $220/20= $11.00
So even though the cost for the actual gas was the same, when you add in all the fees, it appears that gas is much more expensive in the summer when you are actually using less. And that is why the monthly Residential Natural Gas price chart looks so cyclical.
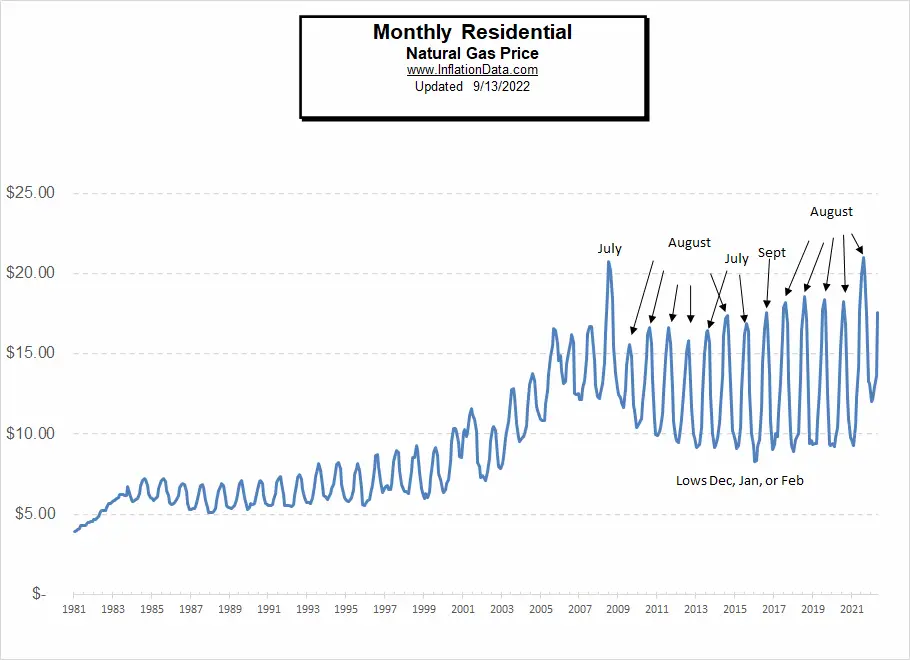
That is also why when we look at the inflation-adjusted price we use annual average prices.
What is the “Real” Inflation Adjusted Price of Natural Gas
In economic speak, the term “real” refers to the Inflation Adjusted Price, in other words, since all prices are increasing (including wages) due to an increase in the money supply, you have to adjust everything using the inflation rate in order to compare prices today with prices from an earlier time. So, theoretically, even though prices are increasing, as long as everything increases at the same rate (including your wages) you would be no worse off. Unfortunately, everything does not increase at the same rate, so you need to adjust prices for inflation in order to see whether they are increasing faster or slower than everything else. Thus getting relatively cheaper or more expensive.
In the following chart, we will look at the inflation-adjusted price of natural gas that residential consumers pay.
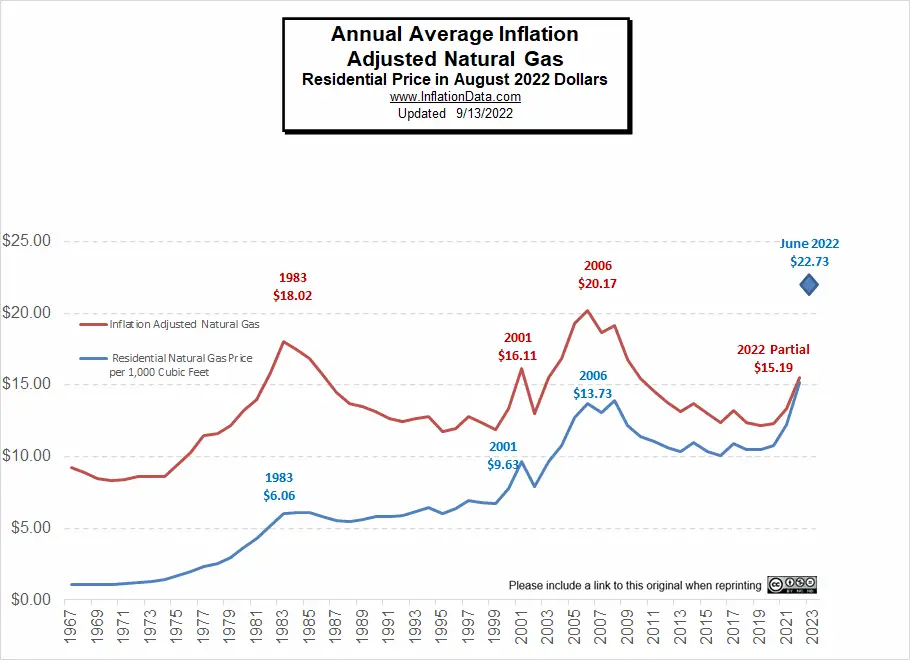
By looking at the inflation-adjusted price we can see that Annual prices in “real” terms are not as high as they have been at times like 1983 and 2006. But the year is only half over and if prices stay as high as they are in June of 2022 the average will exceed the 2006 peak. But as we said above, June is very close to the high for residential gas prices for the year. So the average for the year will probably land somewhere between $15 and $20 bringing it very close to the 2006 peak. Unfortunately, natural gas stockpiles are 8% below last year’s levels and on par with 2018 levels which resulted in a massive spike in natural gas prices when winter demand hit.
Also, note that these prices are only through June of 2022 the last data available through the EIA. Here and here. EIA Natural Gas Data.
Why are Natural Gas Prices So High?
Currently, stricter government regulations combined with increased demand from Europe (due to Russian restrictions) have driven prices for natural gas up. Europe has seen devastating increases in natural gas prices due to its reliance on the Russian gas pipeline. Interestingly, Trump was laughed at when he warned Germany about their reliance on Russian gas.
Part of our higher prices is due to the fact that about 10% of our supply is being converted into Liquified Natural Gas (LNG) and shipped to Europe, where prices are many multiples of what we are paying (as much as 10x).
Most of Europe sided with Ukraine against Russia. In response, Russia cut the supply of natural gas to Europe via Russia’s Nord Stream 1 pipeline. They claim it was to do “maintenance”.
Because of this, European natural gas prices have surged more than 200% since June. One of the worst-hit countries is Germany… Its electricity costs are up nearly fivefold in 2022.
The increases in the U.S. haven’t been as severe. Natural gas has merely doubled here. And the price has come down about 20% in the last three weeks.
Fracking Increases the Supply of Natural Gas
One reason that the price of Natural gas came down from 2013 through 2019 was because of fracking. Fracking greatly increased the supply of natural gas and thus reduced its price. However, in the last few years, Europe has been banning fracking, thus further increasing their reliance on Russian gas.
Other Inflation Adjusted Price Comparisons:
- Historical Oil Prices Chart
- Annual Average Oil Prices in Table Form
- Inflation Adjusted Gasoline Prices
- Inflation Adjusted NYSE Stock Index
- Inflation Adjusted Price of Corn
- Inflation Adjusted College Education Costs
- Inflation Adjusted Electricity Prices
I inherited mineral rights in February 2016, and we recently sold the mineral rights. Our surface acres are in a unit that has a producing gas well, and has been producing since 2012. We need to determine a basis for tax purposes. What would be the best methodology, the price of natural gas at the time of inheritance and at the time of sale, or perhaps historical price of mineral acres at those two times. Our settlement was based on price per net mineral acre. Your input would be appreciated.
I’m not a tax lawyer or mineral specialist but that is a very interesting question. I do know that you should always compare apples to apples so I would guess that if you were paid based on “price per net mineral acre” you should try to calculate your cost basis the same way. Here is an article that might help:
https://www.usmineralexchange.com/blog/mineral-rights-value/calculate-mineral-rights-value/
I’m debating whether to sell mineral rights I have. I inherited it in 1993. I sold the land and retained 1/2 min rights in 2006. I am wondering how to figure the cost basis on these mineral rights. now.
Thanks. SM
Mineral rights are very tricky to calculate. They are totally worthless if there are no minerals and extremely valuable if they are high quality and easily accessible. You should talk to an expert in the field before selling.