The 1940’s was the era of World War, from 1939 through 1941 Germany began invading the neighboring countries of Poland, Denmark, Norway and France. During the same time Russia also invaded Poland and Finland and occupied Latvia, Lithuania, Estonia, and a portion of Romania. Germany and Russia finally face-off against each other in June of 1941. The United States entered the war after the attack on Pearl Harbor on December 7, 1941. Germany surrendered in May 1945 and Japan surrendered in August of that same year.
During the war several countries suffered hyperinflation. From 1942 – 1944 the Philippines suffered under the Japanese which issued a fiat currency which rapidly became worthless. Greece suffered the longest with hyperinflation lasting from 1942 through 1953 resulting in 50,000,000,000,000 to 1 devaluation. Hungary had hyperinflation that was totally astronomical in magnitude from 1945 -1946 the currency exploded 400,000,000,000,000,000,000,000,000,000 to 1. By comparison the well known Hyperinflation in Weimar Germany in 1914-1923 was “only” 1,000,000,000,000 to 1. Many historians believe this hyperinflation was actually an act of war as Russian Marxists tried to destroy the Hungarian middle and upper classes. From 1947 -1949 China suffered hyperinflation of 15,000,000,000,000,000,000 to 1.
The U.S. Consumer Price Index (CPI) from 1940 – 1949
The following table shows the Consumer Price index for the ten years from 1940 through 1949 based upon a 1982-84 base of 100. See Inflation vs Consumer Price Index – Do you know the difference? for more information.
| Year | Jan- | Feb- | Mar- | Apr- | May- | Jun- | Jul- | Aug- | Sep- | Oct- | Nov- | Dec- |
| 1940 | 13.9 | 14.0 | 14.0 | 14.0 | 14.0 | 14.1 | 14.0 | 14.0 | 14.0 | 14.0 | 14.0 | 14.1 |
| 1941 | 14.1 | 14.1 | 14.2 | 14.3 | 14.4 | 14.7 | 14.7 | 14.9 | 15.1 | 15.3 | 15.4 | 15.5 |
| 1942 | 15.7 | 15.8 | 16.0 | 16.1 | 16.3 | 16.3 | 16.4 | 16.5 | 16.5 | 16.7 | 16.8 | 16.9 |
| 1943 | 16.9 | 16.9 | 17.2 | 17.4 | 17.5 | 17.5 | 17.4 | 17.3 | 17.4 | 17.4 | 17.4 | 17.4 |
| 1944 | 17.4 | 17.4 | 17.4 | 17.5 | 17.5 | 17.6 | 17.7 | 17.7 | 17.7 | 17.7 | 17.7 | 17.8 |
| 1945 | 17.8 | 17.8 | 17.8 | 17.8 | 17.9 | 18.1 | 18.1 | 18.1 | 18.1 | 18.1 | 18.1 | 18.2 |
| 1946 | 18.2 | 18.1 | 18.3 | 18.4 | 18.5 | 18.7 | 19.8 | 20.2 | 20.4 | 20.8 | 21.3 | 21.5 |
| 1947 | 21.5 | 21.5 | 21.9 | 21.9 | 21.9 | 22.0 | 22.2 | 22.5 | 23.0 | 23.0 | 23.1 | 23.4 |
| 1948 | 23.7 | 23.5 | 23.4 | 23.8 | 23.9 | 24.1 | 24.4 | 24.5 | 24.5 | 24.4 | 24.2 | 24.1 |
| 1949 | 24.0 | 23.8 | 23.8 | 23.9 | 23.8 | 23.9 | 23.7 | 23.8 | 23.9 | 23.7 | 23.8 | 23.6 |
Inflation from 1940 – 1949
Inflation rates during this period were very volatile, ranging from low in 1940, 1944- early 1946 to high in 1942-43 and 1947-48 but 1949 proved deflationary.
| Year | Jan- | Feb- | Mar- | Apr- | May- | Jun- | Jul- | Aug- | Sep- | Oct- | Nov- | Dec- |
| 1940 | (0.71%) | 0.72% | 0.72% | 1.45% | 1.45% | 2.17% | 1.45% | 1.45% | (0.71%) | 0.00% | 0.00% | 0.71% |
| 1941 | 1.44% | 0.71% | 1.43% | 2.14% | 2.86% | 4.26% | 5.00% | 6.43% | 7.86% | 9.29% | 10.00% | 9.93% |
| 1942 | 11.35% | 12.06% | 12.68% | 12.59% | 13.19% | 10.88% | 11.56% | 10.74% | 9.27% | 9.15% | 9.09% | 9.03% |
| 1943 | 7.64% | 6.96% | 7.50% | 8.07% | 7.36% | 7.36% | 6.10% | 4.85% | 5.45% | 4.19% | 3.57% | 2.96% |
| 1944 | 2.96% | 2.96% | 1.16% | 0.57% | 0.00% | 0.57% | 1.72% | 2.31% | 1.72% | 1.72% | 1.72% | 2.30% |
| 1945 | 2.30% | 2.30% | 2.30% | 1.71% | 2.29% | 2.84% | 2.26% | 2.26% | 2.26% | 2.26% | 2.26% | 2.25% |
| 1946 | 2.25% | 1.69% | 2.81% | 3.37% | 3.35% | 3.31% | 9.39% | 11.60% | 12.71% | 14.92% | 17.68% | 18.13% |
| 1947 | 18.13% | 18.78% | 19.67% | 19.02% | 18.38% | 17.65% | 12.12% | 11.39% | 12.75% | 10.58% | 8.45% | 8.84% |
| 1948 | 10.23% | 9.30% | 6.85% | 8.68% | 9.13% | 9.55% | 9.91% | 8.89% | 6.52% | 6.09% | 4.76% | 2.99% |
| 1949 | 1.27% | 1.28% | 1.71% | 0.42% | (0.42%) | (0.83%) | (2.87%) | (2.86%) | (2.45%) | (2.87%) | (1.65%) | (2.07%) |
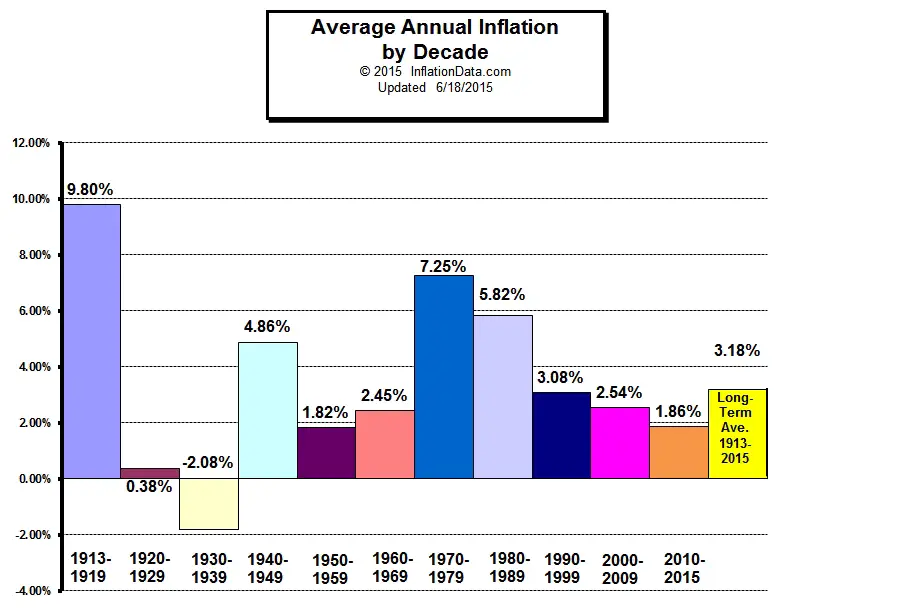
If we look at the Average Annual Inflation by Decade chart we get a different picture. Because some years were high while others were very low, the average inflation for the entire decade appears only moderately bad but the reality for those living during the period was much different. Although the average annual inflation was only 5.52% per year, total cumulative inflation for the entire decade was 69.78%.
Inflation Chart 1940 – 1949
 Click Chart for larger Image
Cost of Living in the 1940’s
The cost of living in the 1940’s was a mere fraction of what it is today. The average wage earner only made about $1300 per year with the average teacher earning $1440. Minimum wage was $.43/hr with the average person working 40+ hours a week i.e. making $17.20/week before taxes or $894.40 per year. The tax rates were adjusted four times during the 1940’s. In 1941 there were 32 different tax brackets with the lowest bracket paying 10% and the highest bracket paying a whopping 81% marginal income tax on income over $5 million. In 2014 dollars that would be the equivalent of about $80 million.
War is Expensive and the Government had to Raise Taxes
In 1942 the tax rate was “simplified “and reduced to only 24 different brackets but those in the lowest bracket now had to pay 19% while those in the highest bracket having to pay 88% but the highest bracket was now only $200,000 so rate was not only higher but the net was also cast much wider.
In 1944, there were still only 24 brackets but the lowest rate was raised to 23% and the highest rate was raised to 94%. These high rates were lowered a bit in 1946 to 20% and 91% respectively. They remained at these levels until 1964 when the brackets were adjusted again (to 26) and rates lowered to 16% and 77% and the top bracket became $400,000.
See Also:
 |
 |
 |
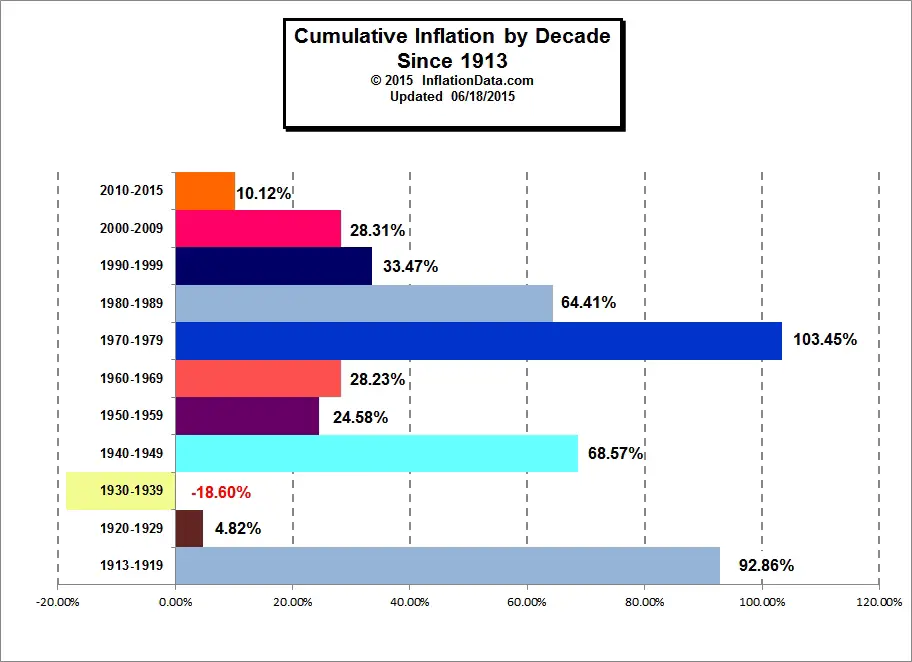
| Average Annual Inflation by Decade | Total Inflation by Decade | Total Cumulative Inflation |
- Inflation and Consumer Price Index- Decade Commentary
- WWI – The beginning of the of the CPI the Inflationary period 1913 – 1919
- The “Roaring Twenties” Inflation and Deflation 1920-1929
- The Great Depression and the Deflationary 1930′s– 1930-1939
- World War II — the volatile 1940′s– High and Low Inflation 1940-1949 –This Page
- The 1950′s “Happy Days”– Inflation and CPI 1950-1959
- The 1960′s the age of possibility– Low Inflation 1960-1969
- The Inflationary 1970’s Inflation and CPI 1970-1979
- The Reagan Era Lower Inflation 1980-1989
- The Decade of Free Enterprise Inflation 1990-1999
During WWII, was the inflation mostly in food and energy or in other commodities aside from food and energy?
Rodger,
That is a good question. During the war, there were a lot of unusual economic forces in play. Consumer items were in short supply because production was being diverted to War materials. Food, Gas and things like shoes were subject to rationing (people got Ration tickets allowing them to buy stuff) so there was also a dual price system (i.e. Black market prices). The government instituted price controls as well. See: https://fee.org/articles/the-two-price-system-us-rationing-during-world-war-ii/ for more information.
Dear Sir, I have gone through your website, however, I am rather confused. Could you please kind enough to let me know how to calculate inflation rate by decades w.r.t. CPI upto december 2014 if the the wages of Rs.112 per annum in January 1851. kindly oblige and do the needful. Regards
Dear Ismail,
Each country has a different inflation rate based on their own currency. If your country publishes a CPI index you can use the inflation formula on this page: http://inflationdata.com/inflation/Inflation_Articles/CalculateInflation.asp and using the index number for the beginning of the decade and the ending of the decade you can calculate the total inflation for that decade. Just remember that you don’t want to use the January data for the beginning (since it comes from the end of the month) instead use the previous December number so for the 2000 decade you would use December 2000 – December 2010 or December 1999 – December 2009. Hope this helps.