
Inflation soars from 1970-1979. Although the 1960s were an age of possibility and budget surpluses, in the second half of the decade President Johnson set out to spend those surpluses on social programs and by the 1970s inflation had taken hold. The decade is marked by an explosion in the development of solid-state physics, driven by the development of the integrated circuit, and the laser.
While the 1960s were characterized by successful space missions the 1970’s began on a sour note as on April 11, 1970, Apollo 13 was a disaster as an oxygen tank exploded and the lunar landing was aborted, and in 1973 when Skylab was damaged during launch removing one of two main solar panel arrays and jamming the other one so that it could not deploy.  The decade ended with Skylab crashing into the ocean near Australia due to a lack of power.
Economically, the major driving force was the “Arab Oil Embargo” which was partially the result of retaliation against U.S. support for Israel in the 1967 Six-Day War and the 1973 Arab–Israeli War. It was also partially the result of the downfall of the U.S. dollar. Due to the declining value of the dollar, gold was under-priced and France was insisting on buying all the cheap gold possible. So Nixon was forced to admit that the dollar was no longer “as good as gold”. Thus he canceled the long-standing policy of converting dollars to gold at the fixed price of $35/ounce. This is referred to as “closing the gold window”. This resulted in a repudiation of the dollar by most of the rest of the world and its value fell even faster.
In an effort to shore up the value of the dollar and patch up relations with Saudi Arabia, Nixon and Kissinger cut a deal that appeared so beneficial that the Saudi’s couldn’t refuse. Shortly thereafter the other OPEC nations signed similar agreements.
Simply stated the agreement provided that the U.S. would supply military support to Saudi Arabia in exchange not for oil as the Saudi’s expected, but instead for a simple agreement that all oil sales would be denominated only in U.S. dollars. Prior to this, oil was priced in dollars but settlement could be made in any local currency. This deal required that other countries actually pay only in U.S. dollars and then Saudi Arabia would deposit its excess dollars into the purchase of U.S. treasury bills. This boosted the flagging demand for dollars worldwide since everyone needed to buy dollars first in order to purchase oil, while at the same time it also boosted the sale of Treasury obligations. This allowed the U.S. to export much of its inflation over the coming decades as excess dollars remained offshore rather than circulating within the U.S and causing inflation. See Oil, Petrodollars and Gold., How Nixon’s One Revolutionary Move Influenced Inflation For 50 Years, and How Does a Country “Export” its Inflation?.
The Misery Index 1970s
The “misery index” was created as a simple measure of the well-being of the general populous by economist Arthur Okun in the 1960s by simply adding the unemployment rate on top of the inflation rate. By the 1970’s “stagflation” had set in. Stagflation is a condition where the economy stagnates in spite of rampant inflation.
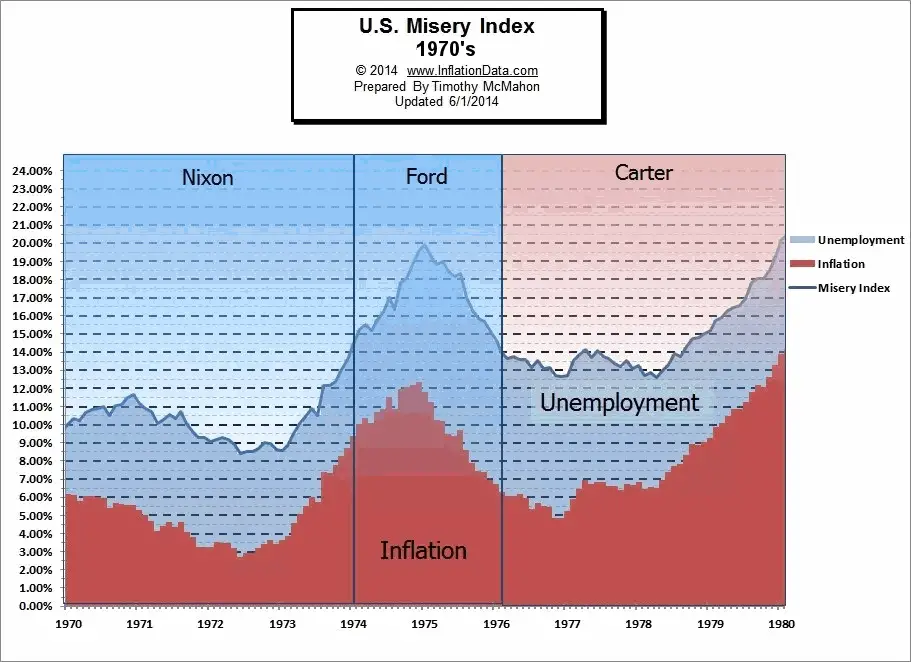
Although Carter’s campaign relied heavily on the misery index and how miserable the economy had become Misery index levels under his administration never fell much below the levels where he assumed office and during the 2nd half of his term actually approached previous highs.
The Consumer Price Index CPI from 1970 – 1979
| Year | Jan- | Feb- | Mar- | Apr- | May- | Jun- | Jul- | Aug- | Sep- | Oct- | Nov- | Dec- |
| 1970 | 37.8 | 38.0 | 38.2 | 38.5 | 38.6 | 38.8 | 39.0 | 39.0 | 39.2 | 39.4 | 39.6 | 39.8 |
| 1971 | 39.8 | 39.9 | 40.0 | 40.1 | 40.3 | 40.6 | 40.7 | 40.8 | 40.8 | 40.9 | 40.9 | 41.1 |
| 1972 | 41.1 | 41.3 | 41.4 | 41.5 | 41.6 | 41.7 | 41.9 | 42.0 | 42.1 | 42.3 | 42.4 | 42.5 |
| 1973 | 42.6 | 42.9 | 43.3 | 43.6 | 43.9 | 44.2 | 44.3 | 45.1 | 45.2 | 45.6 | 45.9 | 46.2 |
| 1974 | 46.6 | 47.2 | 47.8 | 48.0 | 48.6 | 49.0 | 49.4 | 50.0 | 50.6 | 51.1 | 51.5 | 51.9 |
| 1975 | 52.1 | 52.5 | 52.7 | 52.9 | 53.2 | 53.6 | 54.2 | 54.3 | 54.6 | 54.9 | 55.3 | 55.5 |
| 1976 | 55.6 | 55.8 | 55.9 | 56.1 | 56.5 | 56.8 | 57.1 | 57.4 | 57.6 | 57.9 | 58.0 | 58.2 |
| 1977 | 58.5 | 59.1 | 59.5 | 60.0 | 60.3 | 60.7 | 61.0 | 61.2 | 61.4 | 61.6 | 61.9 | 62.1 |
| 1978 | 62.5 | 62.9 | 63.4 | 63.9 | 64.5 | 65.2 | 65.7 | 66.0 | 66.5 | 67.1 | 67.4 | 67.7 |
| 1979 | 68.3 | 69.1 | 69.8 | 70.6 | 71.5 | 72.3 | 73.1 | 73.8 | 74.6 | 75.2 | 75.9 | 76.7 |
Annual Inflation from 1970 – 1979
| Year | Jan | Feb | Mar | Apr | May | Jun | Jul | Aug | Sep | Oct | Nov | Dec |
| 1970 | 6.18% | 6.15% | 5.82% | 6.06% | 6.04% | 6.01% | 5.98% | 5.41% | 5.66% | 5.63% | 5.60% | 5.57% |
| 1971 | 5.29 % | 5.00% | 4.71% | 4.16% | %4.40 | 4.64% | 4.36% | 4.62% | 4.08% | 3.81% | 3.28% | 3.27% |
| 1972 | 3.27% | 3.51% | 3.50% | 3.49% | 3.23% | 2.71% | 2.95% | 2.94% | 3.19% | 3.42% | 3.67% | 3.41% |
| 1973 | 3.65% | 3.87% | 4.59% | 5.06% | 5.53% | 6.00% | 5.73% | 7.38% | 7.36% | 7.80% | 8.25% | 8.71% |
| 1974 | 9.39% | 10.02% | 10.39% | 10.09% | 10.71% | 10.86% | 11.51% | 10.86% | 11.95% | 12.06% | 12.20% | 12.34% |
| 1975 | 11.80% | 11.23% | 10.25% | 10.21% | 9.47% | 9.39% | 9.72% | 8.60% | 7.91% | 7.44% | 7.38% | 6.94% |
| 1976 | 6.72% | 6.29% | 6.07% | 6.05% | 6.20% | 5.97% | 5.35% | 5.71% | 5.49% | 5.46% | 4.88% | 4.86% |
| 1977 | 5.22% | 5.91% | 6.44% | 6.95% | 6.73% | 6.87% | 6.83% | 6.62% | 6.60% | 6.39% | 6.72% | 6.70% |
| 1978 | 6.84% | 6.43% | 6.55% | 6.50% | 6.97% | 7.41% | 7.70% | 7.84% | 8.31% | 8.93% | 8.89% | 9.02% |
| 1979 | 9.28% | 9.86% | 10.09% | 10.49% | 10.85% | 10.89% | 11.26% | 11.82% | 12.18% | 12.07% | 12.61% | 13.29% |
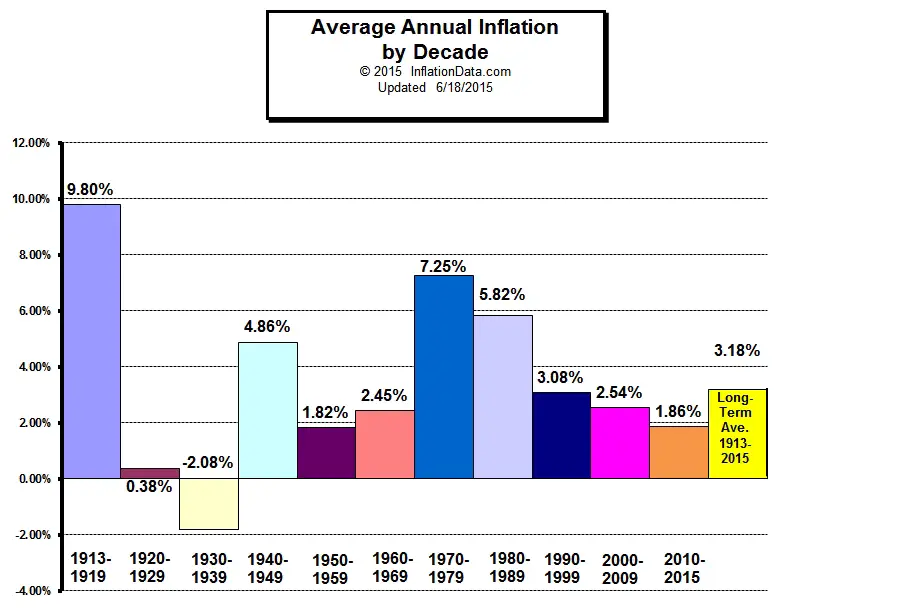
From the Average Annual Inflation by Decade chart we can see that the average inflation for the 1970′s was an inflationary 7.25%.
Click Image for more information
Inflation 1970- 1979 Chart
The following chart shows the inflation rates during the period from 1970-1979.

See Also:
 |
 |
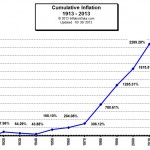 |
| Average Annual Inflation by Decade | Total Inflation by Decade | Total Cumulative Inflation |
- Inflation and Consumer Price Index- Decade Commentary
- WWI – The beginning of the of the CPI the Inflationary period 1913 – 1919
- The “Roaring Twenties” Inflation and Deflation 1920-1929
- The Great Depression and the Deflationary 1930′s– 1930-1939
- World War II — the volatile 1940′s– High and Low Inflation 1940-1949
- The 1950′s “Happy Days”– Inflation and CPI 1950-1959
- The 1960′s the age of possibility– Low Inflation 1960-1969
- The Inflationary 1970’s Inflation and CPI 1970-1979
- The Reagan Era Lower Inflation 1980-1989
- The Decade of Free Enterprise Inflation 1990-1999
How was the inflation rate calculated in 1970? What products were used in the calculation?
What products are included in 2022?
Gene, Although the calculations were basically the same in the 1970s, the “base year” has since been changed. Although this doesn’t change the percentages it does make the index look better i.e. rather than an index of 200 (indicating 100% inflation) they readjusted the index to be 100 sometime between 1982 and 1984… July 1983 comes the closest at 99.9. I have no idea why they didn’t just choose one specific date rather than some crazy average. Unless they purposely wanted to confuse the issue. Since the index is almost 300 again I wonder if they will reindex it again sometime.
But the major difference between the calculations then and now is the addition of components like Computers, smartphones and other technology. They do regularly readjust the composition to more accurately reflect what people are actually buying. If they didn’t they’d still be including horse bridles and butter churns from the index back in 1913.
What’s the base period of the CPI ?
The base period is a bit strange on this one. For some reason, the BLS decided to take an average of the period from 1982-1984 and set it as the base. So it is approximately July or August of 1983– 99.9 and 100.2 respectively.
Very well done!
Should be required reading for all the dollar/DXY experts on Twitter!
Your information is insightful. I am looking forward to your updates for the current decades. (Note: Your 1970’s Misery Index is mislabeled at 1960’s).
Thanks! I’ve fixed the Chart label.
Gene, Although the calculations were basically the same in the 1970s, the “base year” has since been changed. Although this doesn’t change the percentages it does make the index look better i.e. rather than an index of 200 (indicating 100% inflation) they readjusted the index to be 100 sometime between 1982 and 1984… July 1983 comes the closest at 99.9. I have no idea why they didn’t just choose one specific date rather than some crazy average. Unless they purposely wanted to confuse the issue. Since the index is almost 300 again I wonder if they will reindex it again sometime.
But the major difference between the calculations then and now is the addition of components like Computers, smartphones and other technology. They do regularly readjust the composition to more accurately reflect what people are actually buying. If they didn’t they’d still be including horse bridles and butter churns from the index back in 1913.