Today’s Featured Post
August 2025 Inflation Report
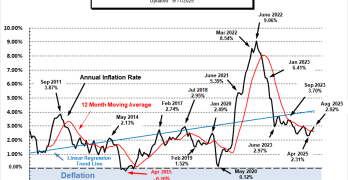
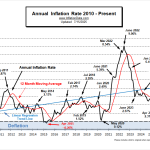
The U.S. Bureau of Labor Statistics released its August 2025 Inflation report on September 11th, 2025. The report showed that Annual Inflation was up at 2.9%. Calculated to two digits, it was 2.70% in July and 2.92% in August. The market is 90% certain that the FED will lower rates on September 17th despite rising inflation. August’s Inflation Prediction: At 2.92%, August's inflation numbers came at our “likely high”. Most economists had projected 2.9% as well. Go here to view our … [Read More...]
Latest Articles
Is the FED Getting Soft on Inflation?
In his final speech at the conclusion of the Jackson Hole Summit, FED Chairman Jerome Powell announced a major policy change and hinted at a rate cut in September.
Remember in 2020, Congress told the FED to prioritize jobs over inflation. However, throughout 2024 and 2025, Powell’s fear of inflation has led him to prioritize fighting inflation over creating jobs.
Powell’s major policy announcement was that the FED would no longer target 2% inflation. Many pundits believe that the new target will be somewhere around 3% (which is where we are now) or possibly even 4%. Additionally, Powell said that from here on out, the FED will be targeting maximum employment rather than inflation (which could kick inflation up from current levels).
July Inflation Report
The U.S. Bureau of Labor Statistics released its July 2025 Inflation report on August 12th, 2025. The report showed that Annual Inflation was unchanged at 2.7%.
Calculated to two digits, it was 2.67% in June and 2.70% in July. So, although the BLS says it was unchanged it was actually up VERY slightly. The market responded positively with the NYSE up 226.57 points.
AI Is Deflationary But Its Energy Demand Could Fuel Inflation

Artificial intelligence is being heralded as one of the most transformative technologies of all time, with the potential to radically improve productivity, reduce costs, and drive economic growth. But as the AI revolution unfolds, a paradox is emerging: AI has deep deflationary potential, yet its explosive demand for electricity and infrastructure introduces inflationary pressures. Understanding these contradictory forces is essential to understanding how Artificial Intelligence could shape macroeconomic trends in the coming decade.
June Inflation Up Again
The U.S. Bureau of Labor Statistics released its June 2025 Inflation report on July 15th, 2025. The report showed that Annual Inflation was up from 2.4% in May to 2.7% in June.
Calculated to two digits, it was really 2.35% in May and 2.67% in June.
Economists were predicting higher inflation, of 2.6% while our MIP was projecting an “Extreme High” of 2.63%.