
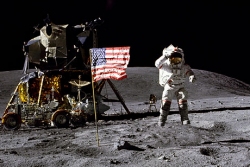
The 1960’s was an age of possibility, in April of 1961 the Soviet Union put the first man in space and in May of 1961 President Kennedy set the goal of putting the first man on the moon by the end of the decade. “Muscle cars” were popular, industrial robots were developed as were geosynchronous communications satellites, 8-Track and cassette tapes, and the world’s first “supercomputer”. Everything seemed possible.
 In popular culture, the civil rights movement gained momentum, along with an anti-war “hippie” culture developed and communes gained popularity. Partially due to the increased criminalization of drug use and partially due to the anti-war movement many college campuses saw violent confrontations between college students (and other activists) and law enforcement.
In the political arena, in 1961 the Berlin wall was built to stem the tide of people fleeing communism. The U.S. was embroiled in the Vietnam War, Kennedy was assassinated, Johnson assumed the Presidency and was reelected and remained President through January 1969.
The Economy in the 1960’s
In the 1960’s economist Arthur Okun created a simple system for measuring economic well-being called the “misery index” which was simply the inflation rate plus the unemployment rate. Interestingly during the 1960’s the misery index was one of the lowest on record dipping below 6% in late 1965.
 Click for Larger Image
During the first half of the decade inflation remained below 2% while unemployment began around 7% and declined to 3.7% in 1966. The misery index bottomed in November of 1965 at 5.7% with unemployment at 4.1% and inflation at 1.6%. Shortly thereafter Johnson announced his “Great Society” initiative which began expanding social programs and by the end of the decade the misery index had nearly doubled to slightly below 10% (December 1969 inflation 6.2% and unemployment 3.5%). And by 1975 the misery index was almost 20%.
The Consumer Price Index CPI from 1960 – 1969
| Year | Jan- | Feb- | Mar- | Apr- | May- | Jun- | Jul- | Aug- | Sep- | Oct- | Nov- | Dec- |
| 1960 | 29.3 | 29.4 | 29.4 | 29.5 | 29.5 | 29.6 | 29.6 | 29.6 | 29.6 | 29.8 | 29.8 | 29.8 |
| 1961 | 29.8 | 29.8 | 29.8 | 29.8 | 29.8 | 29.8 | 30.0 | 29.9 | 30.0 | 30.0 | 30.0 | 30.0 |
| 1962 | 30.0 | 30.1 | 30.1 | 30.2 | 30.2 | 30.2 | 30.3 | 30.3 | 30.4 | 30.4 | 30.4 | 30.4 |
| 1963 | 30.4 | 30.4 | 30.5 | 30.5 | 30.5 | 30.6 | 30.7 | 30.7 | 30.7 | 30.8 | 30.8 | 30.9 |
| 1964 | 30.9 | 30.9 | 30.9 | 30.9 | 30.9 | 31.0 | 31.1 | 31.0 | 31.1 | 31.1 | 31.2 | 31.2 |
| 1965 | 31.2 | 31.2 | 31.3 | 31.4 | 31.4 | 31.6 | 31.6 | 31.6 | 31.6 | 31.7 | 31.7 | 31.8 |
| 1966 | 31.8 | 32.0 | 32.1 | 32.3 | 32.3 | 32.4 | 32.5 | 32.7 | 32.7 | 32.9 | 32.9 | 32.9 |
| 1967 | 32.9 | 32.9 | 33.0 | 33.1 | 33.2 | 33.3 | 33.4 | 33.5 | 33.6 | 33.7 | 33.8 | 33.9 |
| 1968 | 34.1 | 34.2 | 34.3 | 34.4 | 34.5 | 34.7 | 34.9 | 35.0 | 35.1 | 35.3 | 35.4 | 35.5 |
| 1969 | 35.6 | 35.8 | 36.1 | 36.3 | 36.4 | 36.6 | 36.8 | 37.0 | 37.1 | 37.3 | 37.5 | 37.7 |
Annual Inflation from 1960 – 1969
| Year | Jan | Feb | Mar | Apr | May | Jun | Jul | Aug | Sep | Oct | Nov | Dec |
| 1960 | 1.03% | 1.73% | 1.73% | 1.72% | 1.72% | 1.72% | 1.37% | 1.37% | 1.02% | 1.36% | 1.36% | 1.36% |
| 1961 | 1.71% | 1.36% | 1.36% | 1.02% | 1.02% | 0.68% | 1.35% | 1.01% | 1.35% | 0.67% | 0.67% | 0.67% |
| 1962 | 0.67% | 1.01% | 1.01% | 1.34% | 1.34% | 1.34% | 1.00% | 1.34% | 1.33% | 1.33% | 1.33% | 1.33% |
| 1963 | 1.33 | 1.00% | 1.33% | 0.99% | 0.99% | 1.32% | 1.32% | 1.32% | 0.99% | 1.32% | 1.32% | 1.64% |
| 1964 | 1.64% | 1.64% | 1.31% | 1.31% | 1.31% | 1.31% | 1.30% | 0.98% | 1.30% | 0.97% | 1.30% | 0.97% |
| 1965 | 0.97% | 0.97% | 1.29% | 1.62% | 1.62% | 1.94% | 1.61% | 1.94% | 1.61% | 1.93% | 1.60% | 1.92% |
| 1966 | 1.92% | 2.56% | 2.56% | 2.87% | 2.87% | 2.53% | 2.85% | 3.48% | 3.48% | 3.79% | 3.79% | 3.46% |
| 1967 | 3.46% | 2.81% | 2.80% | 2.48% | 2.79% | 2.78% | 2.77% | 2.45% | 2.75% | 2.43% | 2.74% | 3.04% |
| 1968 | 3.65% | 3.95% | 3.94% | 3.93% | 3.92% | 4.20% | 4.49% | 4.48% | 4.46% | 4.75% | 4.73% | 4.72% |
| 1969 | 4.40% | 4.68% | 5.25% | 5.52% | 5.51% | 5.48% | 5.44% | 5.71% | 5.70% | 5.67% | 5.93% | 6.20% |
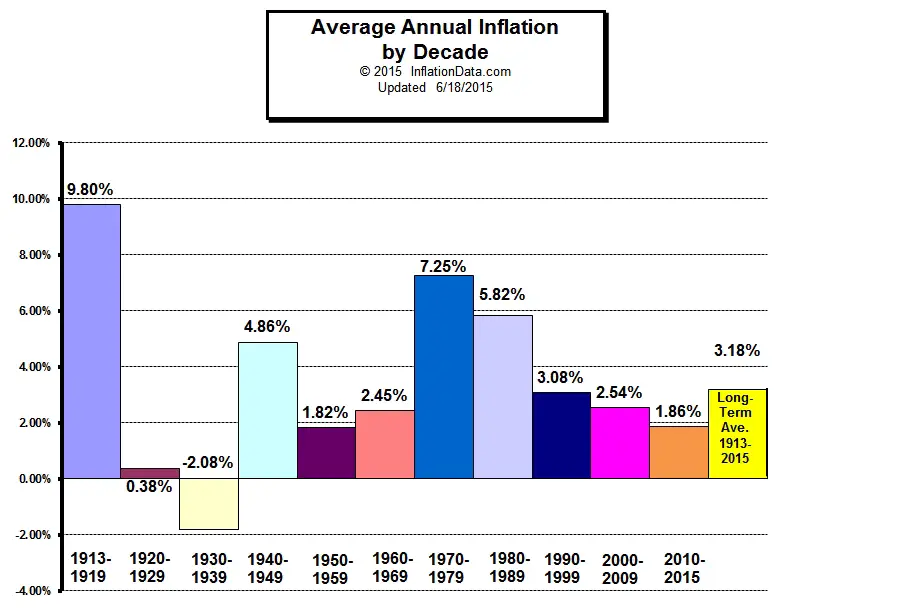
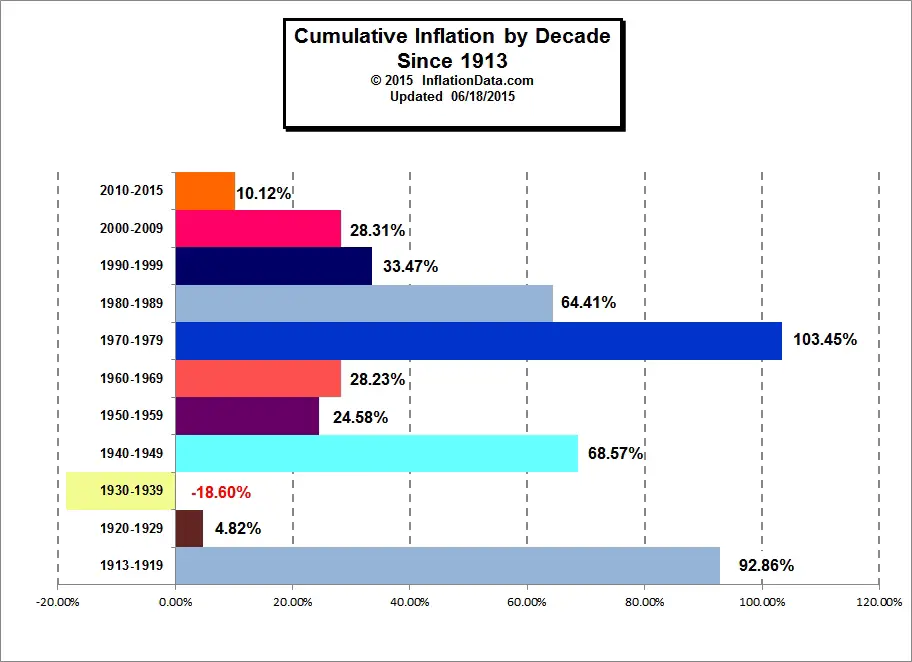
From the Average Annual Inflation by Decade chart we can see that the average inflation for the 1960′s was a moderate 2.32%.
Click Image for more information
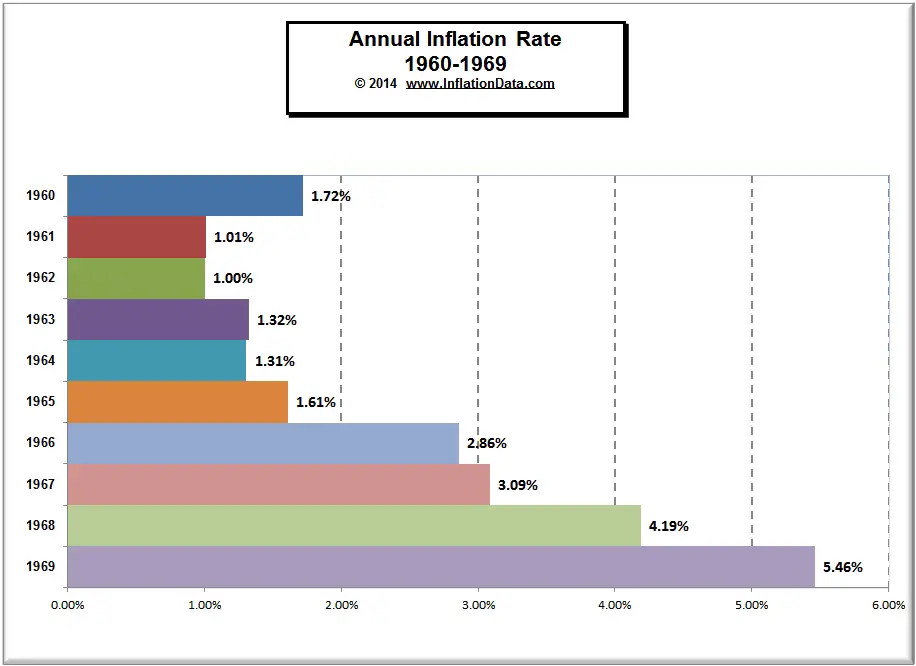
Inflation Chart 1960- 1969
The following chart shows the inflation rates during the period from 1960-1969.
See Also:
 |
 |
 |
| Average Annual Inflation by Decade | Total Inflation by Decade | Total Cumulative Inflation |
- Inflation and Consumer Price Index- Decade Commentary
- WWI – The beginning of the of the CPI the Inflationary period 1913 – 1919
- The “Roaring Twenties” Inflation and Deflation 1920-1929
- The Great Depression and the Deflationary 1930′s– 1930-1939
- World War II — the volatile 1940′s– High and Low Inflation 1940-1949
- The 1950′s “Happy Days”– Inflation and CPI 1950-1959
- The 1960′s the age of possibility– Low Inflation 1960-1969 – This Page
- The Inflationary 1970’s Inflation and CPI 1970-1979
- The Reagan Era Lower Inflation 1980-1989
- The Decade of Free Enterprise Inflation 1990-1999
Leave a Reply