
Although we tend to think of the 1950’s as “Happy Days” made up of greasers and hot rods, the “fifties” were not all peaceful and roses. The 1950’s began with the “Cold War” between the United States and the Soviet Union as clashes between communism and capitalism dominated the decade. In some ways it could be considered a decade of “war by proxy” as the proponents on both sides financed small wars in remote locations. One such war, this time in Korea, lasted from 1950-1953 and the decade ended with the Vietnam War which began in 1959. In between, 1956 was marked by the Suez crisis fought in Egypt over the Suez canal. Algeria was at war from 1954-1962, Cuba was in revolution from 1953-1959. In the U.S. the prevailing sentiment was a fear of Communism and the growing “Eastern Bloc”.
Seeds of Optimism and Discovery
 On the home front America was still young and growing, in 1959 Alaska and Hawaii became the 49th and 50th states. Television although commercially available since the 1920’s finally became economically affordable for the average family in the 1950’s. In 1950 4.4 million families in America had a television set and by 1960 that number had increased to 52 million (or almost 90% of the households). In 1952, the first commercial jet airliner entered service and the first semiconductor was developed. In 1954 a polypropylene plastic was simultaneously invented by Giulio Natta and German chemist Karl Rehn and that same year solar cells were invented. The polio vaccine was discovered by Jonas Salk in 1955. In 1957, one of the first computer programs to play electronic music, was created. And in 1958, NASA was created for peaceful rather than military purposes.
The Consumer Price Index CPI from 1950 – 1959
| Year | Jan- | Feb- | Mar- | Apr- | May- | Jun- | Jul- | Aug- | Sep- | Oct- | Nov- | Dec- |
| 1950 | 23.5 | 23.5 | 23.6 | 23.6 | 23.7 | 23.8 | 24.1 | 24.3 | 24.4 | 24.6 | 24.7 | 25.0 |
| 1951 | 25.4 | 25.7 | 25.8 | 25.8 | 25.9 | 25.9 | 25.9 | 25.9 | 26.1 | 26.2 | 26.4 | 26.5 |
| 1952 | 26.5 | 26.3 | 26.3 | 26.4 | 26.4 | 26.5 | 26.7 | 26.7 | 26.7 | 26.7 | 26.7 | 26.7 |
| 1953 | 26.6 | 26.5 | 26.6 | 26.6 | 26.7 | 26.8 | 26.8 | 26.9 | 26.9 | 27.0 | 26.9 | 26.9 |
| 1954 | 26.9 | 26.9 | 26.9 | 26.8 | 26.9 | 26.9 | 26.9 | 26.9 | 26.8 | 26.8 | 26.8 | 26.7 |
| 1955 | 26.7 | 26.7 | 26.7 | 26.7 | 26.7 | 26.7 | 26.8 | 26.8 | 26.9 | 26.9 | 26.9 | 26.8 |
| 1956 | 26.8 | 26.8 | 26.8 | 26.9 | 27.0 | 27.2 | 27.4 | 27.3 | 27.4 | 27.5 | 27.5 | 27.6 |
| 1957 | 27.6 | 27.7 | 27.8 | 27.9 | 28.0 | 28.1 | 28.3 | 28.3 | 28.3 | 28.3 | 28.4 | 28.4 |
| 1958 | 28.6 | 28.6 | 28.8 | 28.9 | 28.9 | 28.9 | 29.0 | 28.9 | 28.9 | 28.9 | 29.0 | 28.9 |
| 1959 | 29.0 | 28.9 | 28.9 | 29.0 | 29.0 | 29.1 | 29.2 | 29.2 | 29.3 | 29.4 | 29.4 | 29.4 |
Annual Inflation 1950 – 1959
The decade began with deflation. Each 12 month period ending in January through June of 1950 was deflationary but the first full year of the decade (ending in January 1951) was highly inflationary at over 8%. For the next several months inflation hovered around 9%. 1952 and 53 were better as inflation moderated while 1954 and 55 fell into deflation. Through out the remainder of the decade inflation remained moderate.
| Year | Jan- | Feb- | Mar- | Apr- | May- | Jun- | Jul- | Aug- | Sep- | Oct- | Nov- | Dec- |
| 1950 | (2.08%) | (1.26%) | (0.84%) | (1.26%) | (0.42%) | (0.42%) | 1.69% | 2.10% | 2.09% | 3.80% | 3.78% | 5.93% |
| 1951 | 8.09% | 9.36% | 9.32% | 9.32% | 9.28% | 8.82% | 7.47% | 6.58% | 6.97% | 6.50% | 6.88% | 6.00% |
| 1952 | 4.33% | 2.33% | 1.94% | 2.33% | 1.93% | 2.32% | 3.09% | 3.09% | 2.30% | 1.91% | 1.14% | 0.75% |
| 1953 | 0.38% | 0.76% | 1.14% | 0.76% | 1.14% | 1.13% | 0.37% | 0.75% | 0.75% | 1.12% | 0.75% | 0.75% |
| 1954 | 1.13% | 1.51% | 1.13% | 0.75% | 0.75% | 0.37% | 0.37% | 0.00% | (0.37%) | (0.74%) | (0.37%) | (0.74%) |
| 1955 | (0.74%) | (0.74%) | (0.74%) | (0.37%) | (0.74%) | (0.74%) | (0.37%) | (0.37%) | 0.37% | 0.37% | 0.37% | 0.37% |
| 1956 | 0.37% | 0.37% | 0.37% | 0.75% | 1.12% | 1.87% | 2.24% | 1.87% | 1.86% | 2.23% | 2.23% | 2.99% |
| 1957 | 2.99% | 3.36% | 3.73% | 3.72% | 3.70% | 3.31% | 3.28% | 3.66% | 3.28% | 2.91% | 3.27% | 2.90% |
| 1958 | 3.62% | 3.25% | 3.60% | 3.58% | 3.21% | 2.85% | 2.47% | 2.12% | 2.12% | 2.12% | 2.11% | 1.76% |
| 1959 | 1.40% | 1.05% | 0.35% | 0.35% | 0.35% | 0.69% | 0.69% | 1.04% | 1.38% | 1.73% | 1.38% | 1.73% |
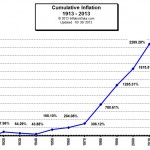
From the chart below: Comparing the average annual inflation for the 1950’s with other decades, we can see that the average inflation for the decade was quite moderate. It was nowhere near the highs of the teens nor the lows of the depression in the 1930’s.
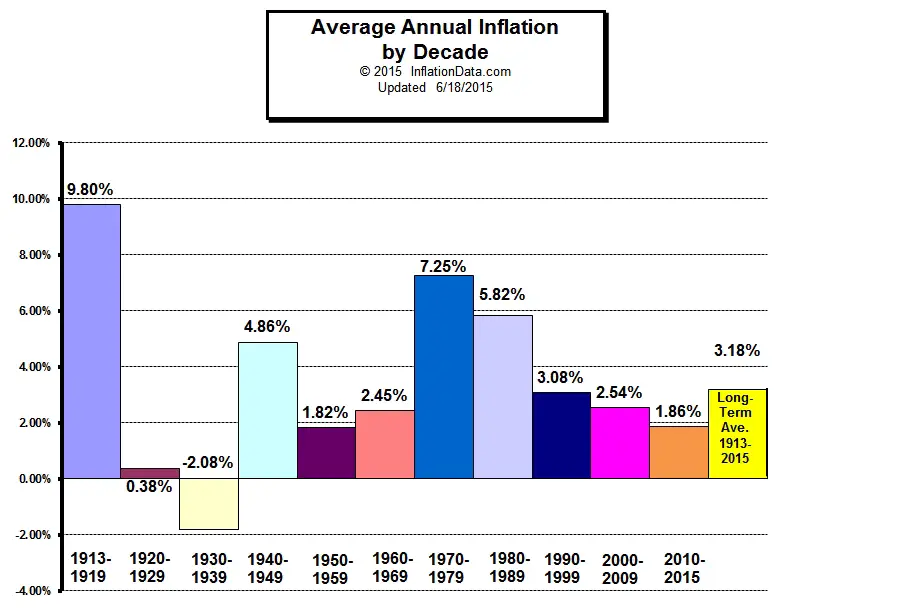
Annual Inflation Rate Chart 1950-1959

See Also:
 |  |  |
| Average Annual Inflation by Decade | Total Inflation by Decade | Total Cumulative Inflation |
- Inflation and Consumer Price Index- Decade Commentary
- WWI – The beginning of the of the CPI the Inflationary period 1913 – 1919
- The “Roaring Twenties” Inflation and Deflation 1920-1929
- The Great Depression and the Deflationary 1930′s– 1930-1939
- World War II — the volatile 1940′s– High and Low Inflation 1940-1949
- The 1950′s “Happy Days”– Inflation and CPI 1950-1959 — This Page
- The 1960′s the age of possibility– Low Inflation 1960-1969
- The Inflationary 1970’s Inflation and CPI 1970-1979
- The Reagan Era Lower Inflation 1980-1989
- The Decade of Free Enterprise Inflation 1990-1999
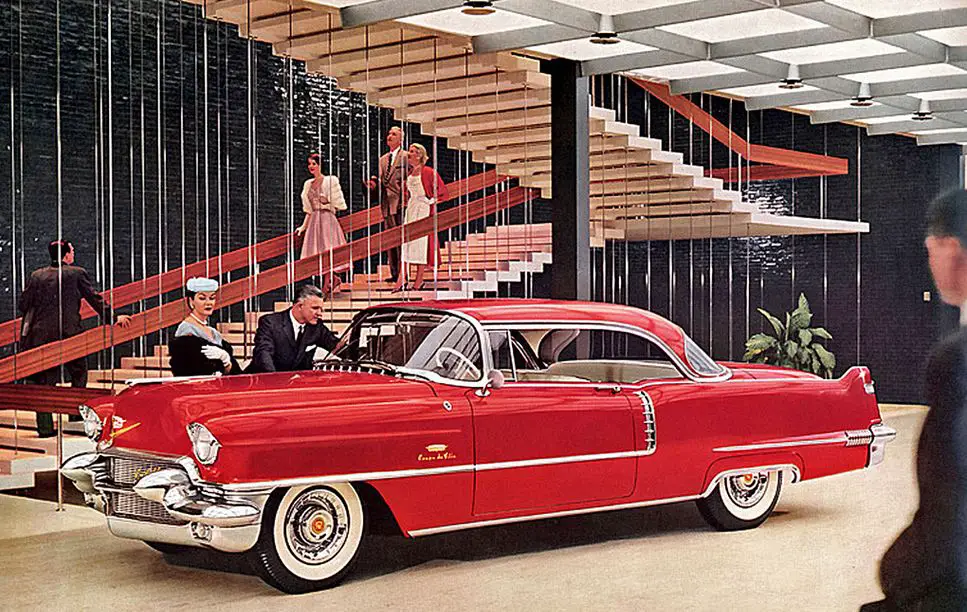
Photo Credits: James Vaughan 1956-Cadillac-GM-lobby
Could you please provide the source for all your data?
Thanks.
All inflation data is based on numbers provided by the U.S. Bureau of Labor Statistics unless otherwise noted. BLS.Gov.