
Inflation-Adjusted Gold Prices
In order to get a true picture of the price of a commodity you need to adjust its price for inflation. Without inflation-adjusting it is like trying to build a house with a different ruler every day. We need a static measurement for prices and the way we do that is to adjust previous prices to the current price yardstick. This is called inflation adjusting. The original price is called the “nominal price” and the adjusted price is called the “real price”. You might think that the actual price paid “back in the day” would be the real price but economists decided that the real “real price” is the one viewed through the current price lens (i.e. adjusted). This makes sense because we are used to the current price. If we think of gas costing $0.29/gallon it is hard to relate. Is that cheap or expensive? It all depends on how it relates to wages and other prices.
Inflation Hedge
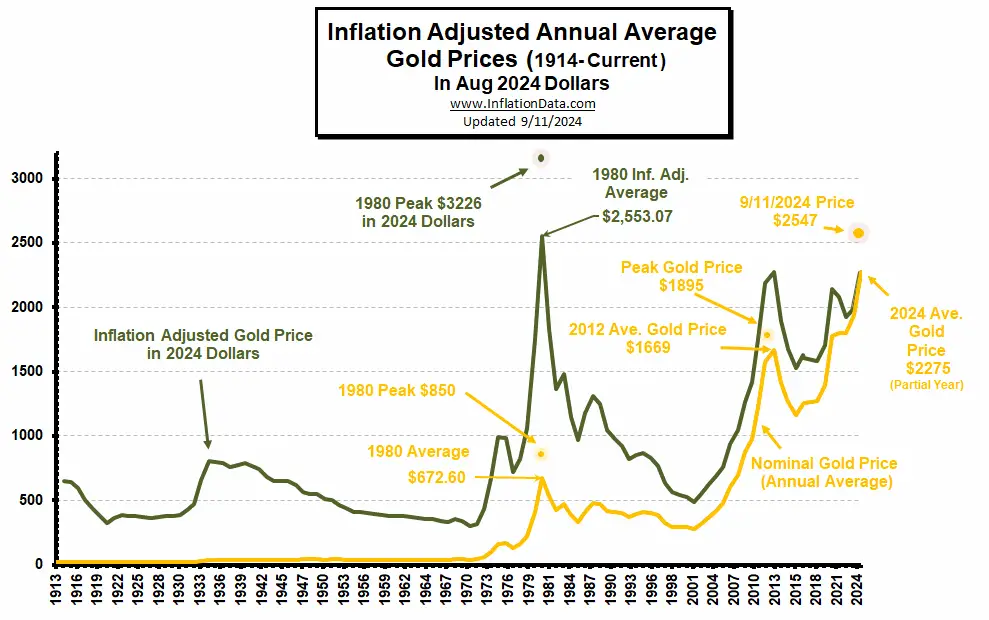
The common wisdom is that gold is a good inflation hedge. This idea became popular in the 1970s. One reason for the popularity of this idea is that historically gold has held its value over centuries. Unfortunately, in the shorter term gold has been more volatile. The following chart shows both the nominal price and the inflation-adjusted price of gold per ounce. If gold were a true 100% inflation hedge its inflation-adjusted price would appear relatively flat on the chart. But as we can see the green inflation-adjusted price line is far from flat.
The average inflation-adjusted gold price since 1980 is $1,299.06 in 2024 dollars.
About the Gold Chart:
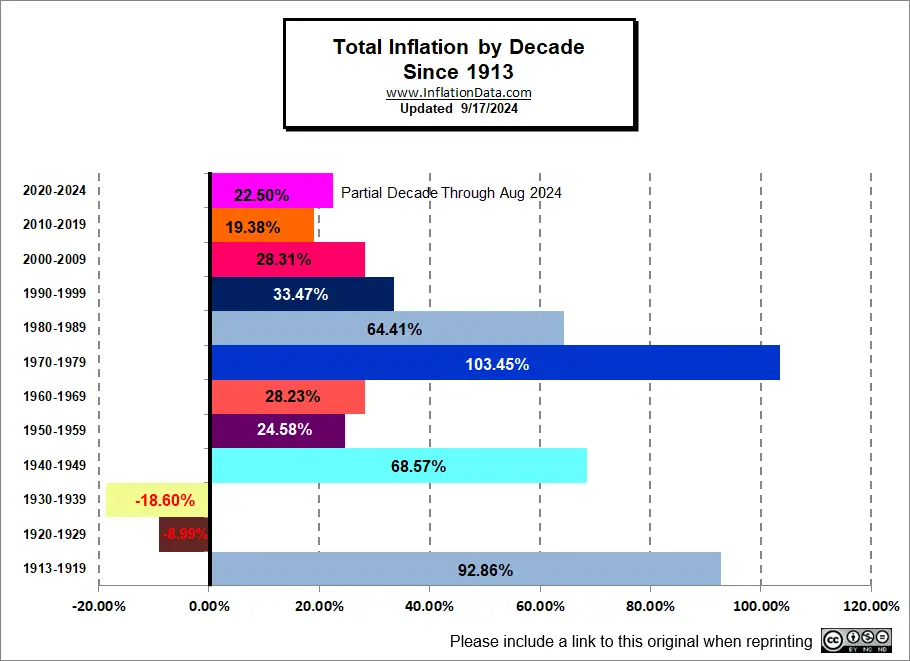
The above chart includes the price of Gold since 1913 when the U.S. government began tracking inflation. The chart below shows annual inflation rates during that period. This was a high inflation period since prices nearly doubled from 1913 to 1919 with 92.86% inflation over those 7 years and the majority of the inflation occurred in 1916-1919. 1913-1915 averaged 2% annual inflation which is exactly what the modern day FED considers optimal. But during that period the gold price was fixed at $20.67 per ounce by law.

Looking at the following two decades, i.e., the Roaring Twenties and the Depressionary Thirties, we can see prices did retreat somewhat but didn’t return to 1913 levels. After falling in the 1920s, from 1913 to 1930 prices were still up about 64% … but the government still artificially held the price of gold in dollars at $20.67. So you can’t blame gold for not keeping up during that period.
Then in 1933, President Franklin Roosevelt pulled one of the biggest gold scams in history by confiscating the gold (outlawing individual ownership) and promptly revaluing it to $35 per Troy ounce. Thus the government made a handsome 69.33% profit in a few months (equivalent to a 69% tax on Gold owners). This put gold in line with the inflated dollar price again. The official gold price remained at $35 an ounce until the Government could no longer maintain the pretense that gold was only worth $35 an ounce when the free market price was $40.95. France was more than willing to buy U.S. gold at $35/ounce and sell it on the open market for $40.95.
So in 1971, President Nixon ended the US gold standard pretense and “closed the gold window”. At that point, the price of gold bullion was allowed to float freely and find its own level. And private citizens were once again allowed to own gold.
At that point, there was a lot of pent-up demand so the price of gold shot up from an artificial $35 an ounce in 1970 to a peak of $850 in 1980. Initially, the price was held in check by the government selling some of the gold they had confiscated back under FDR. But by 1980, supply couldn’t keep up with demand. You would expect that after all the pent-up demand was satisfied that gold would settle into an equilibrium price. But instead for the next 20 years, gold drifted lower and lower to a low of $264 in the year 2000. This is despite price inflation of about 100% from 1980 through 2000. So, if you bought gold at its peak in 1980, in the year 2000 you would have lost 68.9% in nominal terms and about 85% in purchasing power.
Interestingly, as inflation moderated since 2000, gold has actually begun performing better. See the full history of gold prices in our article: Gold is a “Crisis Hedge” not an “Inflation Hedge”.
Inflation Adjusted Gold Price Analysis:
If we average the inflation-adjusted gold price since 1913 we find the average price is $849.50 in 2024 dollars. If we eliminate the period when the gold price was fixed at $20.67 and average only the market price since 1933 (not the government price) we get an inflation-adjusted gold price of $936.26 in 2024 dollars. The last time the inflation-adjusted gold price was near there was in 2006.
If we want to narrow down the average to just modern times when ordinary Americans were allowed to own gold (which would be a higher demand than if just governments owned gold) we can look at the average since 1980 (eliminating the 1970s to allow prices to stabilize). The average inflation-adjusted gold price since 1980 is $1,299.06 in 2024 dollars.
Inflation-Adjusted Gold Price Table
| Year | Average Nominal Gold Price | Inflation Adjusted Ave Gold Price | Inflation Rate |
| 1913 | $ 20.67 | NA | NA |
| 1914 | $ 20.67 | $646.51 | 1.35% |
| 1915 | $ 20.67 | $640.11 | 0.92% |
| 1916 | $ 20.67 | $593.13 | 7.60% |
| 1917 | $ 20.67 | $505.08 | 17.78% |
| 1918 | $ 20.67 | $428.15 | 17.22% |
| 1919 | $ 20.67 | $373.70 | 15.30% |
| 1920 | $ 20.67 | $323.25 | 15.72% |
| 1921 | $ 20.67 | $361.18 | -10.94% |
| 1922 | $ 20.67 | $384.83 | -6.13% |
| 1923 | $ 20.67 | $378.07 | 1.79% |
| 1924 | $ 20.67 | $378.07 | 0.44% |
| 1925 | $ 20.67 | $369.43 | 2.42% |
| 1926 | $ 20.67 | $365.26 | 0.91% |
| 1927 | $ 20.67 | $371.56 | -1.93% |
| 1928 | $ 20.67 | $378.07 | -1.15% |
| 1929 | $ 20.67 | $378.07 | 0.00% |
| 1930 | $ 20.67 | $387.13 | -2.68% |
| 1931 | $ 20.67 | $425.33 | -8.95% |
| 1932 | $ 20.67 | $471.90 | -10.30% |
| 1933 | $ 27.37 | $658.39 | -5.18% |
| 1934 | $ 34.53 | $805.98 | 3.50% |
| 1935 | $ 35.00 | $799.06 | 2.56% |
| 1936 | $ 35.00 | $787.56 | 1.03% |
| 1937 | $ 35.00 | $760.22 | 3.72% |
| 1938 | $ 35.00 | $776.39 | -2.02% |
| 1939 | $ 35.00 | $787.56 | -1.30% |
| 1940 | $ 34.43 | $769.09 | 0.72% |
| 1941 | $ 34.88 | $742.04 | 5.06% |
| 1942 | $ 35.63 | $683.60 | 10.96% |
| 1943 | $ 36.00 | $650.86 | 5.99% |
| 1944 | $ 36.38 | $646.43 | 1.64% |
| 1945 | $ 37.25 | $647.27 | 2.27% |
| 1946 | $ 38.63 | $619.54 | 8.27% |
| 1947 | $ 40.38 | $566.29 | 14.57% |
| 1948 | $ 42.38 | $549.95 | 7.72% |
| 1949 | $ 41.50 | $545.39 | -0.96% |
| 1950 | $ 39.00 | $506.15 | 1.06% |
| 1951 | $ 42.00 | $505.25 | 7.88% |
| 1952 | $ 39.45 | $465.62 | 2.28% |
| 1953 | $ 37.25 | $436.36 | 0.82% |
| 1954 | $ 35.38 | $411.32 | 0.31% |
| 1955 | $ 35.20 | $410.81 | -0.28% |
| 1956 | $ 35.18 | $404.48 | 1.52% |
| 1957 | $ 35.20 | $391.80 | 3.34% |
| 1958 | $ 35.25 | $381.50 | 2.73% |
| 1959 | $ 35.25 | $378.88 | 1.01% |
| 1960 | $ 35.85 | $378.82 | 1.46% |
| 1961 | $ 35.83 | $374.76 | 1.07% |
| 1962 | $ 35.35 | $366.11 | 1.20% |
| 1963 | $ 35.34 | $361.17 | 1.24% |
| 1964 | $ 35.30 | $356.16 | 1.28% |
| 1965 | $ 35.38 | $351.25 | 1.58% |
| 1966 | $ 35.40 | $341.74 | 3.01% |
| 1967 | $ 35.39 | $331.36 | 2.77% |
| 1968 | $ 39.68 | $356.59 | 4.27% |
| 1969 | $ 39.35 | $335.36 | 5.46% |
| 1970 | $ 37.40 | $301.49 | 5.84% |
| 1971 | $ 40.95 | $316.25 | 4.30% |
| 1972 | $ 57.30 | $428.76 | 3.27% |
| 1973 | $ 95.25 | $670.99 | 6.15% |
| 1974 | $ 156.15 | $990.67 | 11.03% |
| 1975 | $ 168.80 | $981.35 | 9.18% |
| 1976 | $ 130.25 | $715.98 | 5.75% |
| 1977 | $ 158.60 | $818.58 | 6.50% |
| 1978 | $ 221.55 | $1,062.81 | 7.61% |
| 1979 | $ 406.25 | $1,750.21 | 11.22% |
| 1980 | $ 672.60 | $2,553.07 | 13.57% |
| 1981 | $ 531.30 | $1,828.14 | 10.35% |
| 1982 | $ 420.75 | $1,363.73 | 6.15% |
| 1983 | $ 472.05 | $1,482.39 | 3.22% |
| 1984 | $ 382.20 | $1,150.56 | 4.30% |
| 1985 | $ 332.85 | $967.54 | 3.55% |
| 1986 | $ 411.80 | $1,175.19 | 1.90% |
| 1987 | $ 475.55 | $1,309.33 | 3.66% |
| 1988 | $ 472.05 | $1,248.06 | 4.08% |
| 1989 | $ 415.75 | $1,048.68 | 4.83% |
| 1990 | $ 411.35 | $984.39 | 5.39% |
| 1991 | $ 400.90 | $920.64 | 4.25% |
| 1992 | $ 368.85 | $822.29 | 3.03% |
| 1993 | $ 392.50 | $849.58 | 2.95% |
| 1994 | $ 411.10 | $867.62 | 2.61% |
| 1995 | $ 404.05 | $829.24 | 2.81% |
| 1996 | $ 384.55 | $766.83 | 2.93% |
| 1997 | $ 323.85 | $631.04 | 2.34% |
| 1998 | $ 293.95 | $564.02 | 1.55% |
| 1999 | $ 289.15 | $542.93 | 2.19% |
| 2000 | $ 290.23 | $527.15 | 3.38% |
| 2001 | $ 275.05 | $485.86 | 2.83% |
| 2002 | $ 313.73 | $545.52 | 1.58% |
| 2003 | $ 369.38 | $628.03 | 2.27% |
| 2004 | $ 414.63 | $686.59 | 2.67% |
| 2005 | $ 475.65 | $761.79 | 3.39% |
| 2006 | $ 603.46 | $936.29 | 3.23% |
| 2007 | $ 695.39 | $1,048.99 | 2.85% |
| 2008 | $ 871.96 | $1,266.72 | 3.83% |
| 2009 | $ 972.35 | $1,417.60 | -0.35% |
| 2010 | $1,224.53 | $1,756.45 | 1.64% |
| 2011 | $1,571.52 | $2,185.18 | 3.15% |
| 2012 | $1,668.98 | $2,273.65 | 2.07% |
| 2013 | $1,411.23 | $1,894.76 | 1.47% |
| 2014 | $1,266.40 | $1,673.17 | 1.62% |
| 2015 | $1,160.06 | $1,530.85 | 0.12% |
| 2016 | $1,250.74 | $1,629.95 | 1.26% |
| 2017 | $1,257.12 | $1,604.10 | 2.13% |
| 2018 | $1,268.49 | $1,580.01 | 2.21% |
| 2019 | $1,393.34 | $1,704.63 | 2.21% |
| 2020 | $1,773.73 | $2,143.57 | 2.21% |
| 2021 | $1,798.89 | $2,076.43 | 2.21% |
| 2022 | $1,801.87 | $1,925.75 | 2.21% |
| 2023 | $1,943.00 | $1,994.48 | 2.21% |
| 2024 | $2,275.09 | $2,275.09 | 2.21% |
You might also like:
- Gold is a “Crisis Hedge” not an “Inflation Hedge”.
- Comparing Oil vs. Gold
- Civil Liberties Rest Upon Sound Money
- Why (and How) China is Boosting the Price of Gold
Inflation-Adjusted Annual Average Gold Prices Commentary